
Figures & data
Table 1. Calves and age per treatment.
Table 2. Description of experimental procedures and timing pre- and post-treatment.
Table 3. Blood samples sampling time for each variable collected relative to castration (0 h (h)).
Figure 1. Scrotal latitudinal (A) and longitudinal (B) circumferences.
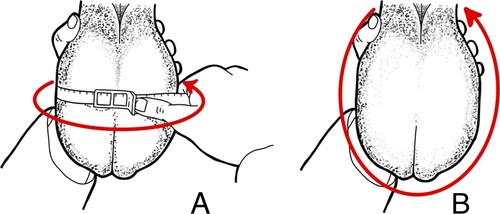
Table 4. Ethogram used for categorizing behavioural observations of suckled beef calves after castration.
Figure 2. Diagram of bodyweight sampling time points and average daily gain (ADG) intervals.
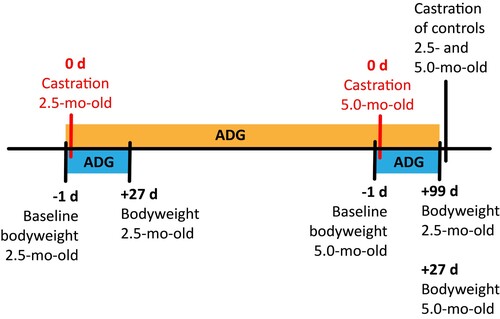
Figure 3. Effect of Burdizzo castration at 2.5- and 5.0-mo-old on the difference in AUC (dAUC) plasma cortisol concentrations in calves. The area under the cortisol response curve (area under the curve; AUC) was calculated from 0 to 4 h (primary response; AUC1), and from 4 to 9 h after treatment (secondary response; AUC2) using the linear trapezoidal rule as described by Ting et al. (Citation2003a). The difference in cortisol AUC was expressed as the difference between the AUC of the treatment group and the respective control from 0 to 4 h (dAUC1) and from 4 to 9 h (dAUC2).
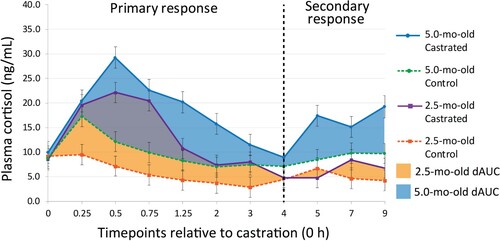
Table 5. Effect of Burdizzo castration at 2.5- and 5.0-mo-old on changes in plasma cortisol concentrations in calves during primary response, from 0 to 4 h post treatment.
Table 6. Effect of Burdizzo castration at 2.5- and 5.0-mo-old on changes in plasma cortisol concentrations in calves during secondary response, from 4 to 9 h post treatment.
Table 7. Effect of Burdizzo castration at 2.5- and 5.0-mo-old on changes in plasma cortisol concentrations in calves.
Table 8. Effect of Burdizzo castration of 2.5- and 5.0-mo-old calves on the adjusted area under the curve from 0 to 4 h (AUC1) and from 4 to 9 h (AUC2) for plasma cortisol concentration.
Table 9. Effect of Burdizzo castration at 2.5- and 5.0-mo-old in difference in the area under the curve (AUC) of cortisol concentration in calves.
Table 10. Effect of Burdizzo castration at 2.5- and 5.0-mo-old on the changes in latitudinal and longitudinal scrotal circumferences relative to pre-treatment baseline.
Table 11. Effect of Burdizzo castration at 2.5- and 5.0-mo-old on behaviour of calves during 3 h of continuous observations post treatment.
Table 12. Effect of Burdizzo castration at 2.5- and 5.0-mo-old on behaviour of calves during scan observations (3 h blocks).
Table 13. Effect of Burdizzo castration at 2.5- and 5.0-mo-old on changes on haematological profiles of bull calves.
Table 14. Effect of Burdizzo castration at 2.5- and 5.0-mo-old on changes on serum haptoglobin, non-esterified fatty acids (NEFA) and beta-hydroxybutyrate (BHB) concentrations in calves.