
Figures & data
Table 1. Ingredient composition of diets fed during close-up (−21 d relative to calving) and early lactation (+29 d relative to calving) periods.
Table 2. Nutrient composition and evaluation of diets fed during the close-up (−21 d relative to calving) and early lactation (+29 d relative to calving) periods.
Figure 1. Milk yield until 30 DIM (A), milk energy output (B), milk fat (C), milk protein (D), milk casein (E), milk fat-to-protein ratio (F), milk total solids (G), and milk urea nitrogen (H) in RPM-supplemented or Control cows. Values are means, with standard errors represented by vertical bars.
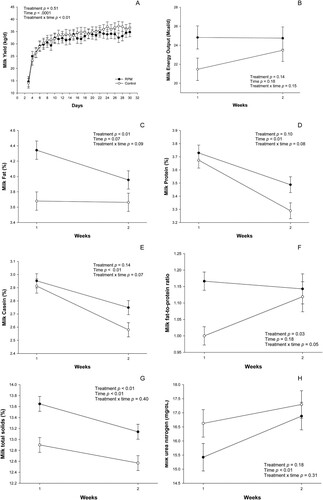
Table 3. Adjusted mean, respective standard error, and statistical significance of milk yield, milk energy output, and milk composition between experimental groups.
Figure 2. Serum urea (A), aspartate aminotransferase (B), triglycerides (C), cholesterol (D), glucose (E), total protein (F), albumin (G), calcium (H), total bilirubin (I), β–hydroxybutyrate (J), and non-esterified fatty acids (K) in RPM-supplemented or Control cows. Values are means, with standard errors represented by vertical bars.
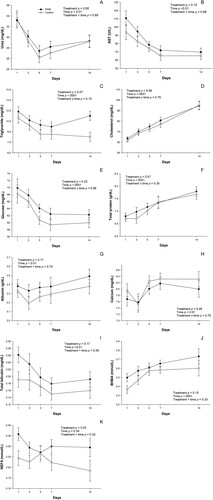
Table 4. Adjusted mean, respective standard error, and statistical significance of blood metabolites in the experimental groups.