
Figures & data
Table 1. Composition of gestation and lactation diets.
Figure 1. Plasma concentration of glucose (a), insulin (b), and HOMA-IR index (c) according to the group. Each point or bar represents the mean ± standard error of mean (SEM; n = 16 gilts by group). *Indicates statistically significant difference (P < 0.05) between groups.
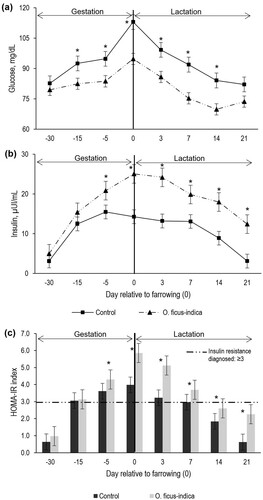
Figure 2. Plasma concentration of triglycerides (a), cholesterol (b), HDL (c), and LDL (d) according to the group. Each point represents the mean ± standard error of mean (SEM; n = 16 gilts by group). *Indicates statistically significant difference (P < 0.05) between groups.
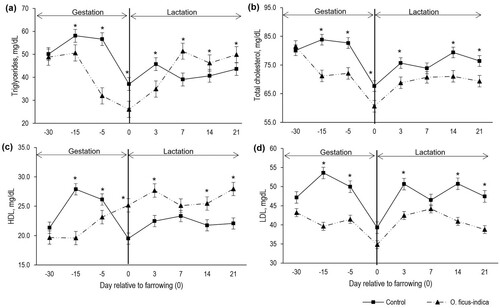
Figure 3. Plasma concentration of leptin according to the group. Each point represents the mean ± standard error of mean (SEM; n = 16 gilts by group). * Indicates statistically significant difference (P < 0.05) between groups.
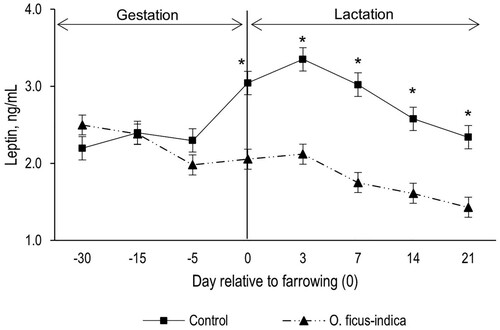
Table 2. Least squares mean for feed intake, energy intake and energy balance of sows according to the group and week of lactation.
Table 3. Least squares mean for the productive performance of the sow and piglets according to the group.