
Figures & data
Figure 1. Goats of DR Congo. (A) goat from the alluvial basin, equatorial forest (Tshopo province), (B) goats from the savannah plateau (Kinshasa province) and (C) goat from the high-altitude volcanic mountains (South Kivu province).
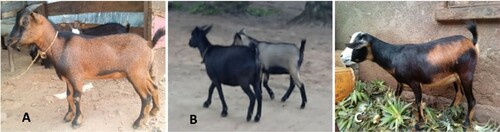
Table 1. Mean and Standard deviation (SD) of morpho biometric traits and reproductive performances of indigenous goat breeds in 3 AEZs of DR Congo.
Figure 2. Hierarchical clustering based on morpho biometric traits and reproductive performances.
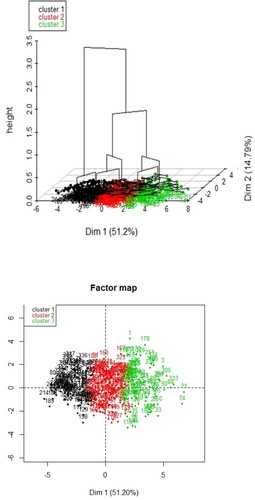
Figure 3. Principal component analysis based on morpho biometric traits and reproductive performances.
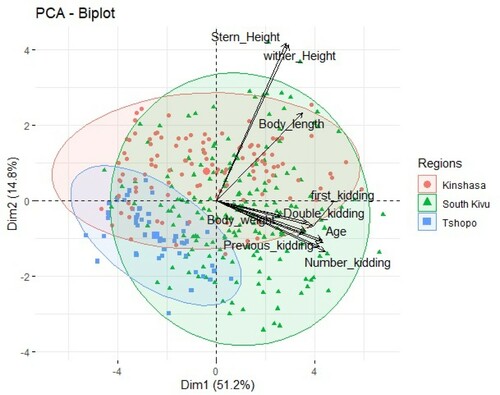
Figure 4. Canonical representation of the morphometric traits and reproductive performances associated with individuals by state.
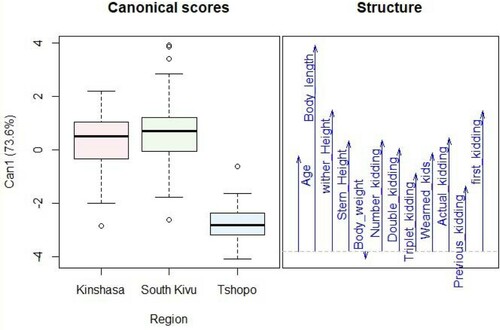
Table 2. Pairwise Mahalanobis’ distances and probability values for the contrasts between local goats from different regions in DR Congo.
Table 3. Description of important traits assisting the choice of doe raised by farmers.