Figures & data
Figure 1. Characterization of identified circRNAs. (A) The chromosome distribution of circRNAs from the hypothalamus; (B) The type of identified circRNAs in the six hypothalamic tissues.
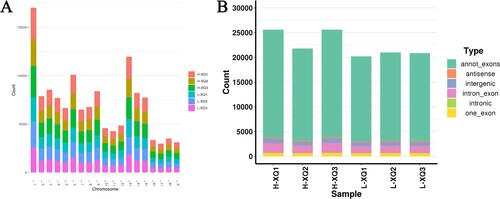
Figure 2. Analysis of differentially expressed circRNAs. (A) The volcano map in HS groups compared to TC groups; (B) The expression pattern of DE circRNAs and hierarchical clustering analysis in HS groups compared to TC groups.
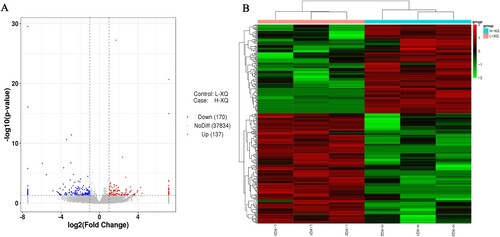
Figure 3. Functional enrichment analysis. (A) The GO enrichment analysis for host genes of the differentially expressed circRNAs; (B) The KEGG pathway analysis for host genes of the differentially expressed circRNAs.
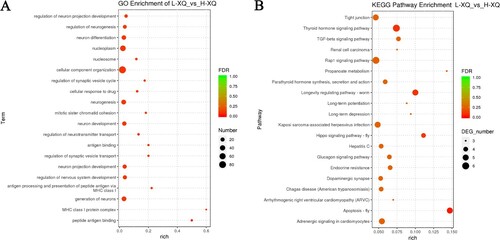
Figure 4. The interaction network of the eight DE circRNAs and their target miRNAs. The red diamond represents upregulated circRNA, the green diamond represents downregulated circRNA, and the yellow oval represents miRNA.
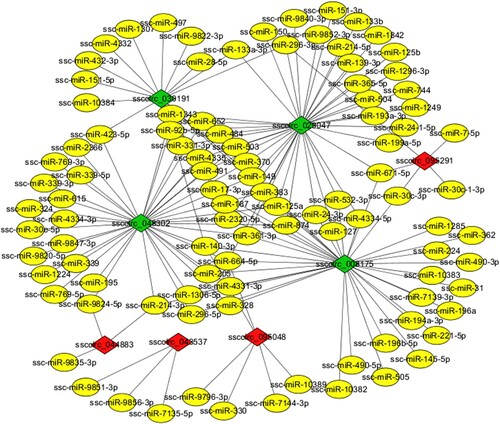
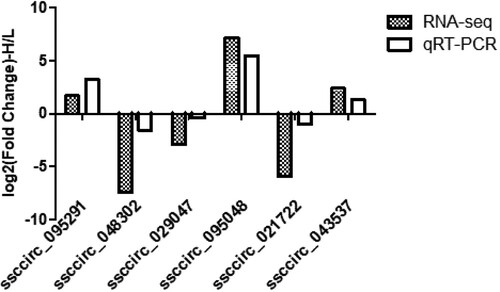
Figure 5. The qRT-PCR validation of the six selected differentially expressed circRNAs in the hypothalamus.