Figures & data
Figure 1. Phylogenetic tree constructed based on the NR5A2 nucleotide sequence of 8 species.
Note: Branches were labelled with species’ names. The number above each branch represented bootstrap values.
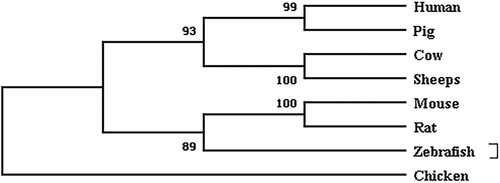
Table 1. Genotypic frequency, allelic frequency and diversity parameter in the exons of the NR5A2 gene in JXB sows (MEAN ± SD).
Figure 2. Analysis of blocks with 5 SNPs in the NR5A2 gene in JXB sows.
Note: The values in the squares indicate the paired linkage disequilibrium (LD) values (D’) of the SNPs. When D’ = 1, the values will not be displayed. The redder the square, the stronger the LD. The haplotype block was defined using the default setting of the Haploview software.
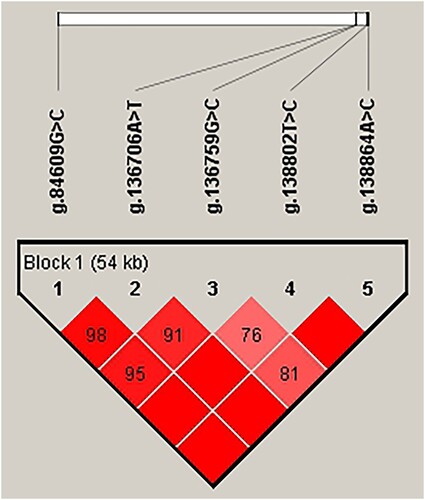
Table 2. Haplotypes based on the block 1 and frequencies in JXB sows.
Table 3. Association of five SNPs of the NR5A2 gene with reproductive traits in Jiaxing Black sows (MEAN ± SD).
Table 4. Association of diplotypes of the NR5A2 gene with reproductive traits in Jiaxing Black sows (MEAN ± SD).
Figure 3. Relative expression levels of pig NR5A2 mRNA in 11tissues with the average ΔCt value of heart as the calibrator.
Note: Data were shown as the mean ± SD for 5 pigs. Columns ‘**’showed highly significant difference (p < 0.01).
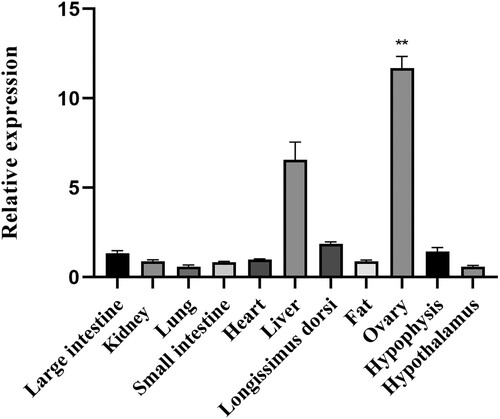
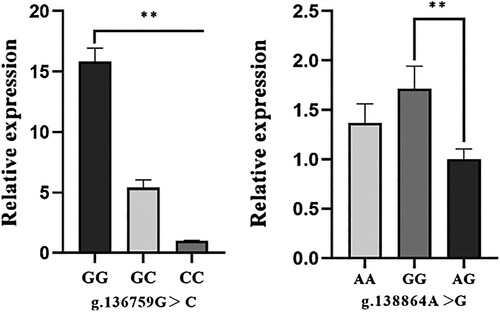
Figure 4. Relative expression levels of the pig NR5A2 mRNA in ovary with different genotypes.
Note: In the loci of g.136759G > C, g.138864A > G with the average ΔCt value of CC and AG genotype as the calibrator, respectively. Data were shown as the mean ± SD for 5 pigs of each genotype. The column with ‘**’ showed a significant difference (p < 0.01).