Figures & data
Table 1. Primers for drug resistance genes for quantitative real time polymerase chain reaction
Figure 1. CMT-Stylo cells (A) and CMT-Star cells (B) in culture.
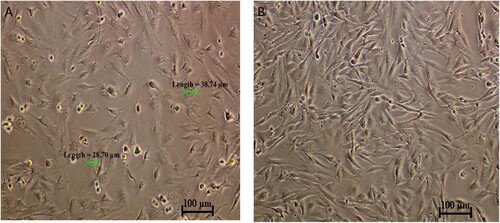
Figure 2. comparative IC50 between CMT-Stylo cells and CMT-Star cells treated with chemotherapeutic drugs. A: The graph shows cell viability plotted against log-transformed doxorubicin concentration in CMT-Stylo and CMT-Star cells. IC50 of doxorubicin of the CMT-Star cells was increased by 1140% compared to that in the CMT-Stylo cells (404 nM vs. 5013 nM). B shows cell viability plotted against log-transformed cyclophosphamide concentration in CMT-Stylo and CMT-Star cells. The IC50 of cyclophosphamide of the CMT-Star cells was increased by 91% compared to that of the CMT-Stylo cells (2714 nM vs. 5885 nM). C shows cell viability plotted against log-transformed carboplatin concentration in CMT-Stylo and CMT-Star cells. The IC50 of carboplatin of the CMT-Star cells was increased by 103.6% compared to that of the CMT-Stylo cells (338.6 nM vs. 689.5 nM). D shows cell viability plotted against log-transformed vincristine concentration in CMT-Stylo and CMT-Star cells. The IC50 of vincristine of the CMT-Star cells was increased by 117.6% compared to that of the CMT-Stylo cells (589.5 nM vs. 1283 nM). E shows cell viability plotted against log-transformed meloxicam concentration in CMT-Stylo and CMT-Star cells. The IC50 of meloxicam of the CMT-Star cells was increased by 42.3% compared to that of the CMT-Stylo cells (1184 nM vs. 1688 nM).
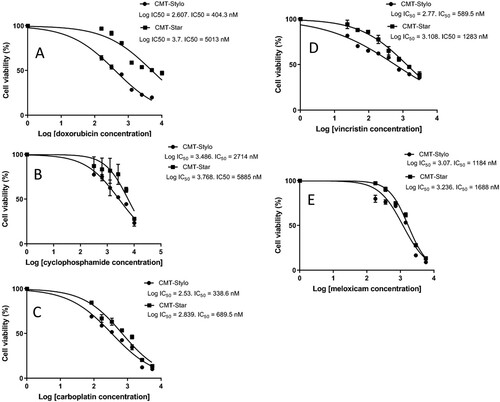
Figure 3. Proliferation curves of CMT-Stylo and CMT-Star cells.
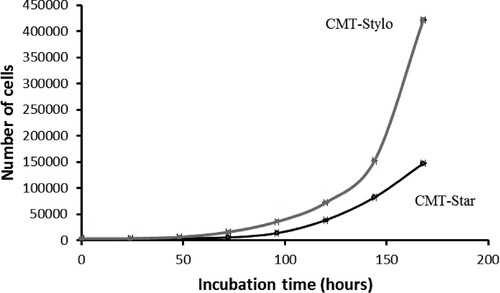
Figure 4. Morphological changes in cells treated with doxorubicin (AO/PI double staining). Apoptosis related cellular changes observed in the cells treated with 100 nM doxorubicin include; BL (membrane blebbing), NF (Nuclear fragmentation), CC (chromatin condensation) and AP (full apoptosis). This figure is of CMT-Stylo cells at 72 h of culture in 100 nM doxorubicin.
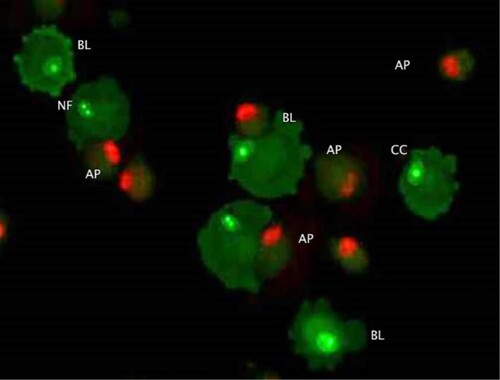
Figure 5. Wound induced migration assay. The wound was induced on the cells using sterile 200 µL pipette tips. The width of the wound created on CMT-Stylo cells was 502.19 µm, while that of CMT-Star cells was 625.58 µm. By 24 h, both wounds are almost completely closed up by the cells.
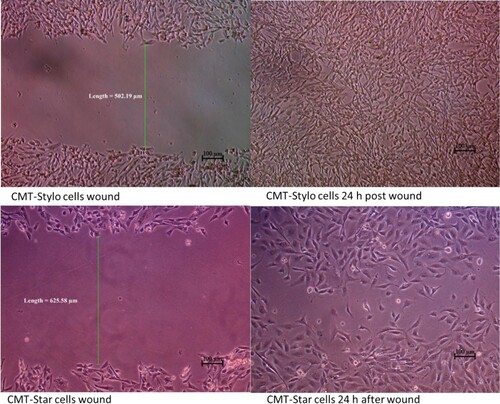
Figure 6. Tumour sphere formation assay of CMT-Stylo (A) and CMT-Star (B) cells. The tumour spheres here were pictured after 7 days of incubation of respective cell lines in stem cell enrichment media, in ultralow attachment plates. The average size of the spheres formed by CMT-Stylo cells is 226 ± 51.2 µm in diameter, while that of CMT-Star cells is 224.5 ± 47.5 µm in diameter. Bar = 100 µm.
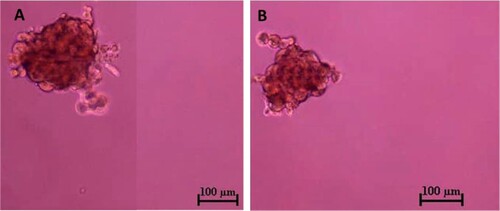
Figure 7. Post-mortem and harvesting of tumour from euthanized NOD/SCID mouse (A) Shows the mouse with tumour of about 2 cm (B) shows in-situ abdominal organs, with the tumour subcutaneously (C) Shows the harvested tumour and (D) shows the cut sections of the harvested tumour.
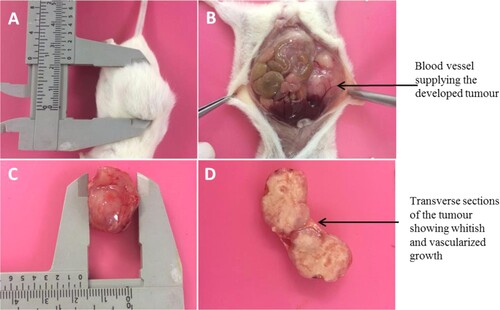
Figure 8. Histopathology of tumours and lung tissues from the mice injected with CMT-Star cells (Bar = 100 µm). Haematoxylin and eosin staining of harvested tumours. The tumours are densely cellular, with areas of connective tissue (A and C). (A) Shows a tumour tissue with the arrow pointing to angiogenesis, (B) shows lung tissue with mild congestion, (C) shows a tumour tissue with the arrow pointing to a tubular structure formed and (D) shows a tumour tissue with the arrow pointing to a mitotic figure. Bars = 100 µm.
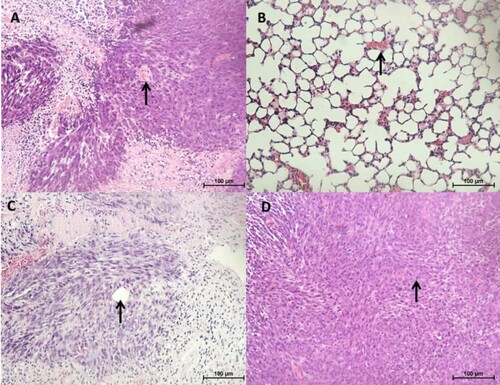
Figure 9. Histopathology of tumours and lung tissues from the mice injected with CMT-Stylo cells (Bar = 100 µm). Haematoxylin and eosin staining of harvested tumours. The tumour tissues are densely cellular. (A) Shows a tumour tissue (from a mouse injected with CMT-Stylo cells) with the arrow pointing to mitotic figures (green arrows) and a blood vessel (black arrow), (B) shows a tumour tissue with the arrow pointing at an invasion of a blood vessel by the tumour cells (from a mouse injected with CMT-Stylo cells). Bars = 100 µm.
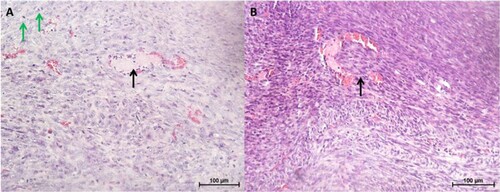
Figure 10. Hierarchical clustering of 1608 differentially expressed entities: 585 upregulated and 1023 downregulated in CMT-Star cells. The technical replicates of each sample demonstrated similar pattern of gene/entities expression by clustering together. From the figure, it is obvious that the doxorubicin-resistant CMT-Star has many of the genes/entities downregulated compared to CMT-Stylo (original cell).
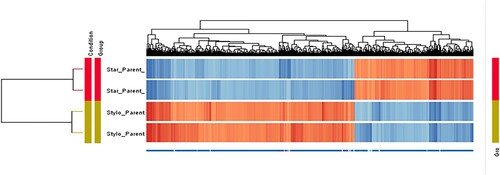
Figure 11. Volcano plots of differentially expressed entities differentially expressed between CMT-Star and CMT-Stylo cells. Entities with different expression in CMT-Star cells compared to CMT-Stylo cells at p < 0.01(y-axis) and absolute fold change of 10 (x-axis) (Benjamini Hochberg moderated t-test). Blue coloured entities are downregulated while the red coloured entities are upregulated in CMT-Star cells. The pale blue, orange and grey-coloured entities did not fall within the cut-off values set for the analysis.
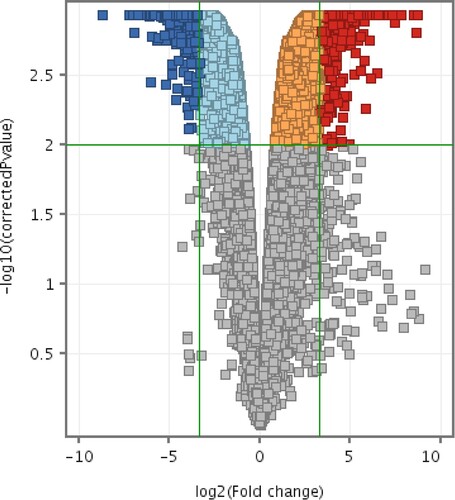
Figure 12. Volcano plot of differentially expressed entities (microRNAs) in CMT-Star cells compared to CMT-Stylo cells. Fourteen entities (miRNAs) differentially transcribed in CMT-Star cells compared to CMT-Stylo cells (with Benjamini Hochberg FDR method) at p value of <0.05 (y-axis) and fold change cut off at 2.0 (x-axis). Blue coloured entities are downregulated while the red coloured entities are upregulated in CMT-Star cells.
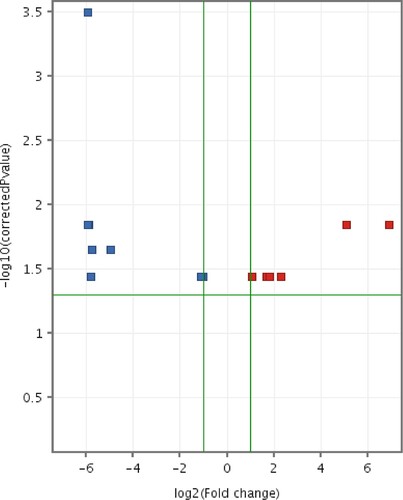
Table 2. Dysregulated microRNAs related to doxorubicin resistance in CMT-Star cells compared with CMT-Stylo cells.
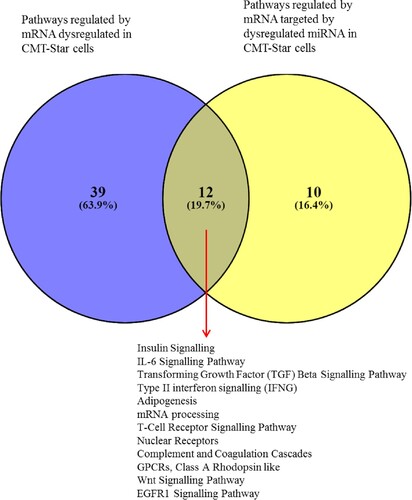
Figure 13. Venn diagram of pathways regulated by mRNA and miRNA in CMT-Star cells. Twelve pathways are commonly regulated in CMT-Star cells from the gene expression microarray results and the miRNA microarray results as shown at the intercept of the Venn diagram; Insulin Signalling, IL-6 Signalling Pathway, Transforming Growth Factor (TGF) Beta Signalling Pathway, Type II interferon signalling (IFNG), Adipogenesis, mRNA processing, T-Cell Receptor Signalling Pathway, Nuclear Receptors, Complement and Coagulation Cascades, GPCRs, Class A Rhodopsin like, Wnt Signalling Pathway, EGFR1 Signalling Pathway.