
Figures & data
Figure 1. Feather phenotype observations during embryogenesis between Anser cygnoide and Anser anser. The measured feather was sampled from the cross-region (about 1.5 cm2) of the midline of the dorsum. Feather length data is shown as mean + SEM, **p < 0.01 by Student’s t-test, n = 120 feathers averagely from 6 embryos.
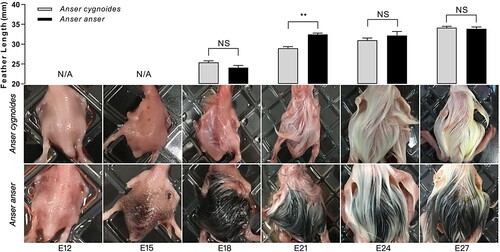
Figure 2. Feather follicle morphology observations during embryogenesis between Anser cygnoide and Anser anser. (a) Feather follicle diameter and representative photographs as investigated by longitudinal dorsal skin sections. n = 60 follicles averagely from 6 embryos. Bar = 50 or 100 μm. Representative photographs (b) and feather follicle densities (c) as investigated by transverse dorsal skin sections. The investigated tissues were sampled from the cross-region (about 1.5 cm2) of the midline of dorsal skin. n = 60 follicles averagely from 6 embryos. Bar = 100 μm. All data is shown as mean + SEM, **p < 0.01 by Student’s t-test. Abbreviations: Pfs, primary feather follicles; Sfs, secondary feather follicles.
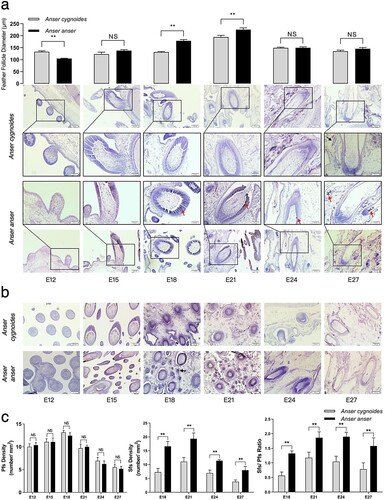
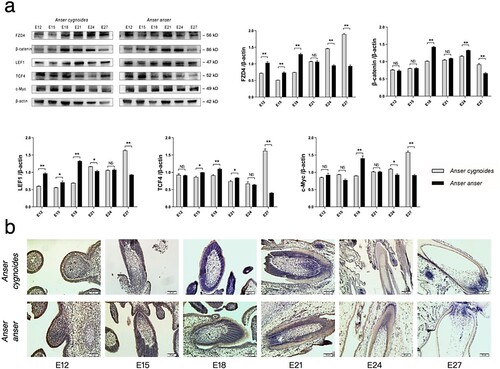
Figure 3. Hub molecular expression in the Wnt signalling pathway in dorsal skin tissues during embryogenesis between Anser cygnoide and Anser anser. (a) The levels of FZD4, β-catenin, LEF1, TCF4 and c-Myc as quantified by western blotting. All blots were from the same gels conducting striping. Data is shown as mean + SEM, *p < 0.05 and **p < 0.01 by Student’s t test, n = 3 embryos. (b) β-catenin distribution in feather follicles during morphogenesis as investigated by IHC. The investigated tissues were sampled from the cross region (about 1.5 cm2) of the midline of dorsal skin. Bar = 50 μm.
TAAR_2066676_Supplementaldata
Download Zip (5.3 MB)Data availability statement
The raw Western blotting images presented in this study are available in the Supplementary Materials.