
Figures & data
Table 1. List of pig serum samples used in this study. All categories of sera were used for the establishment of the LPBE and evaluation of its application in the field. Panels 1 and 2 included sequentially collected serum samples from pigs vaccinated with a monovalent vaccine and subsequently challenged with the homologous vaccine strain of FMDV serotype A (collected at 0, 21 and 28 dpv and at 1–7 dpc). Panel 3 included FMDV-negative sera obtained from naïve pigs that had been neither vaccinated nor infected. Panel 4 included field sera obtained from a conventional pig farm with historical FMD vaccination records.
Figure 1. Frequency distributions of the PI values (%) measured for known positive and negative sera, indicating the presence of antibodies against FMDV serotype A detected by the LPBE. Whether test sera were positive or negative was previously determined based on the level of NAb titers against A/YC (A) and A/PC (B). A reciprocal log10 NAb titer of 1.2 (16-fold) or more was considered positive.
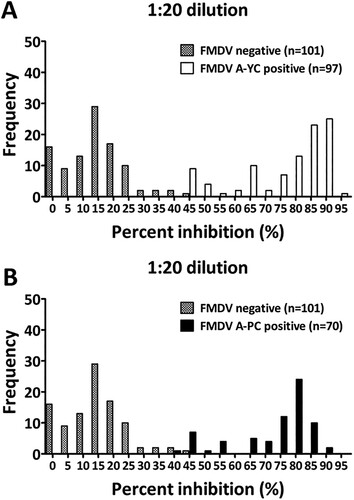
Table 2. Diagnostic performance of the LPBE for the detection of antibodies raised against FMDV serotype A. The diagnostic values of the LPBE for serum panels 1 and 2 were computed by comparison with the results of the VNT using contingency table analysis.
Figure 2. Correlation of endpoint antibody titers measured by the LPBE and VNT in serum panels 1 (n = 142) and 2 (n = 94). To assess agreement between the two assays, scatter plots with linear regression curves and Bland–Altman scatter plots were generated from quantitative data for serum panel 1 (A and C) and serum panel 2 (B and D) obtained with each assay.
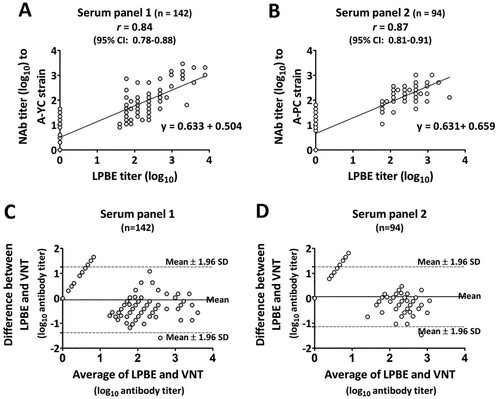
Table 3. Diagnostic performance of the LPBE in comparison to the commercial SP-A ELISA. The diagnostic values of the two different ELISAs for serum panel 4 (n = 148) were computed based on the assumption that the VNT was the standard reference test (gold standard) using contingency table analysis.
Table 4. ROC curve analysis of the LPBE versus the VNT (gold standard) on different categories of serum samples. The optimal cutoff value, diagnostic sensitivity, specificity, accuracy and AUC of the LPBE were computed with a 95% confidence interval. The computed AUC value was near 1, which indicates a higher discriminatory potential to distinguish between positive and negative samples with maximized specificity and sensitivity.