
Figures & data
Figure 1. Layout of the area where the experiment was carried out. (A) Area with environmental enrichment; (B) non-enriched area; (C) feeding area with hay, concentrate and water, and (D) automatic feeder. Total experimental area 700 m2.
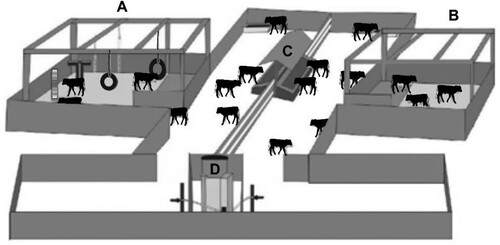
Table 1. Description of the structure of the dependent indicator variables of animal welfare and of the models and procedures used for the analyses.
Figure 2. Observed frequencies of the duration of tactile stimulation (A), mean duration of tactile stimulation (brushing) (B) allowed by heifer calves over 24 days of the experiment according to the presence (EE) or absence (NE) of environmental enrichment.
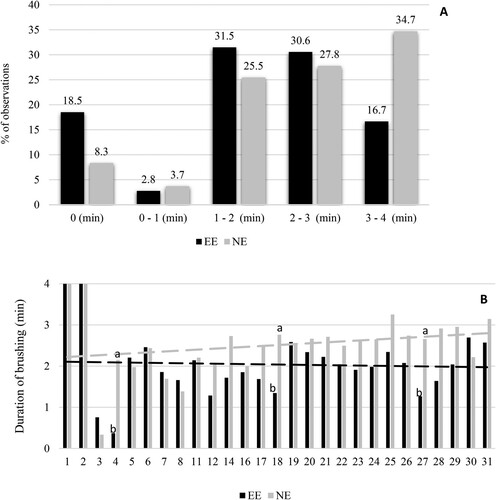
Table 2. Estimated mean time (min) spent in each activity after tactile stimulation over 2 hours of continuous uninterrupted observation (first and second hour) in the presence (EE) or absence (NE) of environmental enrichment.
Figure 3. Suckling speed (A), number of visits to the automatic feeder when food was not available (B), and total number of visits to the feeder (C) according to treatment (presence [EE] and absence [NE] of environmental enrichment). Means with lowercase letters differ significantly between each other on the same day (P < 0.05).
![Figure 3. Suckling speed (A), number of visits to the automatic feeder when food was not available (B), and total number of visits to the feeder (C) according to treatment (presence [EE] and absence [NE] of environmental enrichment). Means with lowercase letters differ significantly between each other on the same day (P < 0.05).](/cms/asset/41f740c9-d451-4d56-bdce-305ba6408653/taar_a_2162531_f0003_ob.jpg)
Table 3. Least square means and respective standard errors of biochemical variables before and after tactile stimulation in the groups receiving (EE) or not (NE) environmental enrichment.
Table 4. Paired analysis of the difference in least square means and respective standard errors of the biochemical variables before and after tactile stimulation in the presence (EE) or absence (NE) of environmental enrichment.