
Figures & data
Table 1. Impact of hydrogen peroxide (H2O2) exposure on the quality of broiler breast meat (adapted from Chen et al. Citation2022).
Figure 1. Oxygen consumption in adipocytes exposed to 2 µM of ATRA was measured using Clarke’s electrode (adapted from Tourniaire et al. Citation2015). Control refers to control cells, which received the vehicle (dimethyl sulfoxide). Data are the mean ± SEM of three independent cultures per treatment condition. The assessment compared ATRA-treated cells to untreated cells and measured their oxygen consumption rates to determine if ATRA-induced gene expression changes altered cellular metabolism. ATRA increased oxygen consumption by 15% (*P < 0.05).
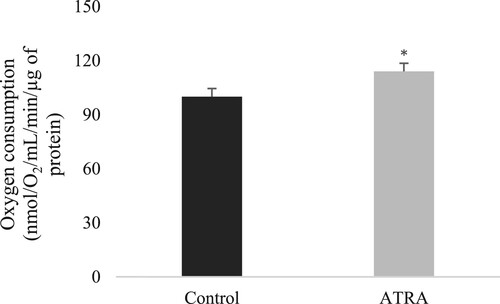
Table 2. Effect of various vitamin A levels in maternal and offspring diets on liver antioxidant index of goslings at one day old and seven days old* (adapted from Liang et al. Citation2019).
Table 3. The effects of two different sources of vitamin A on serum biochemical parameters of weaned piglets on day 36 of the study* (adapted from Zhou et al. Citation2021).
Table 4. Effect of higher vitamin A supplementation on immune and antioxidant function in dairy cows fed experimental diets for 60 d (adapted from Jin et al. Citation2014).