
Figures & data
Table 1. Distribution of experimental animals according to type, breed and sex.
Table 2. Distribution of sensitivity testing animals according to type, breed and sex.
Table 3. Correlation coefficients of weight with body measurements.
Table 4. Parameters of the different mathematical models of regression of body weight (y) on heart girth (x) for the pooled data.
Table 5. Parameters and statistical analysis of Power regressions of body weight (y) on heart girth (x) for the different animals’ groups (type, sex and breeds).
Table 6. Parameters of stepwise multiple regression of body weight on the linear body measurements.
Figure 1. Plotting of body weight predicted by the power regression model on its residue values.
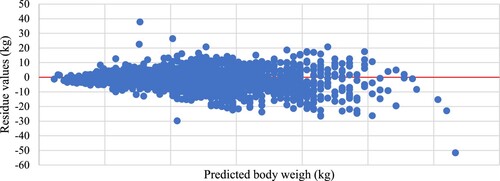
Figure 2. Plotting of body weight predicted by the multiple regression model on its residue values.
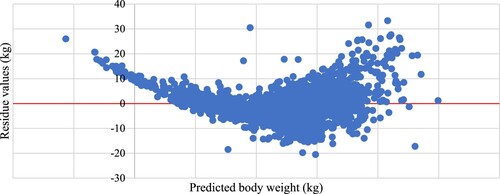
Table 7. Statistical examination of the difference between measured and estimated body weights of sensitivity testing population.
Data availability statement
Raw data were generated at the Animal Research Station, Department of Agricultural Researches, Ministry of Municipalities – Qatar. Derived data supporting the findings of this study are available from the corresponding author [M. Atta] on request.