
Figures & data
Figure 1. QQ plot of the GWAS for prolificacy in CNG.
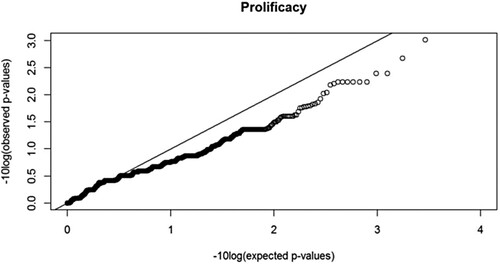
Figure 2. Manhattan plot of GWAS for prolificacy. The red line is a subjective line at −log10 (p) where p = 3 × 10⁻³.
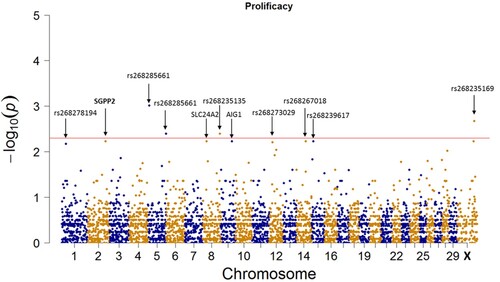
Table 1. List of the first top 20 SNPs markers and their characteristics ranked according to the p-value from the GWAS output for prolificacy in CNG.
Figure 3. Study zone. Source: Adapted from PNGE (Citation2009).
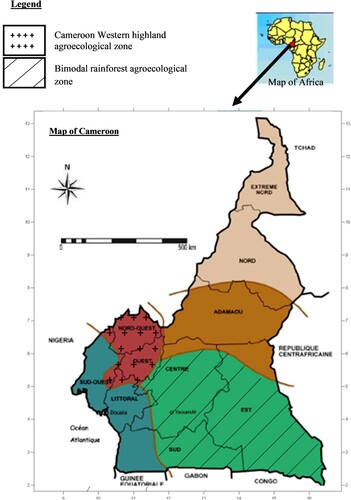
Table 2. Evolution of the number of loaded SNPs per chromosome after quality control and pruning.
Additional_files_Kouam_et_al
Download Zip (10.6 MB)Data availability statement
All data generated or analysed during this study are included in this published article and its supplementary information files. However, data might be commercially sensitive and any further use will require reasonable request with permission from the corresponding author (KOUAM SIMO).