
Figures & data
Figure 1. Shows the four strata of Lake Kariba, Zambia.
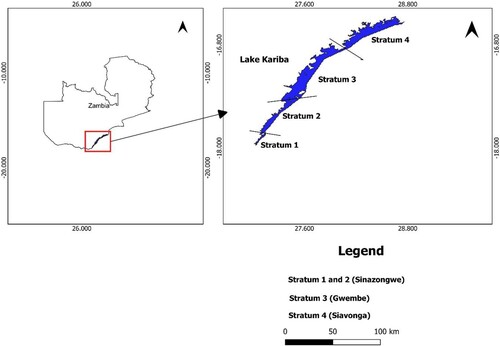
Figure 2. Mean concentrations of trace elements in L. Kariba, Zambia. The error bars represent the standard error and different values represent the mean concentration of each element.
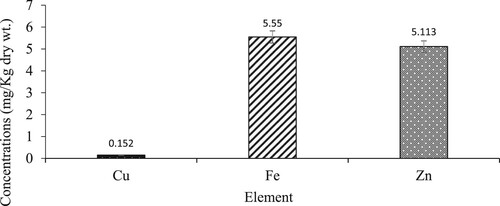
Table 1. Comparison of present study results to selected studies.
Figure 3. Mean concentrations of copper in the four strata of L. Kariba, Zambia. The error bars represent the standard error and different letters show significant differences.
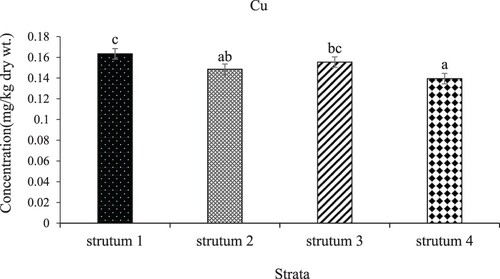
Figure 4. Mean concentrations of iron in the four strata of L. Kariba, Zambia. The error bars represent the standard error and different letters show significant differences.
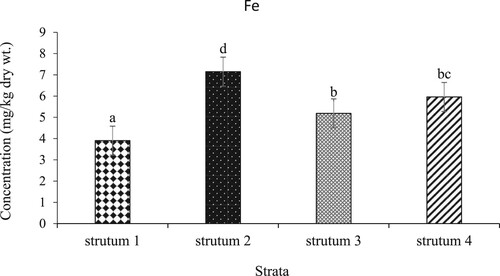
Figure 5. Mean concentrations of zinc in the four strata of L. Kariba, Zambia. The error bars represent the standard error and different letters show significant differences.
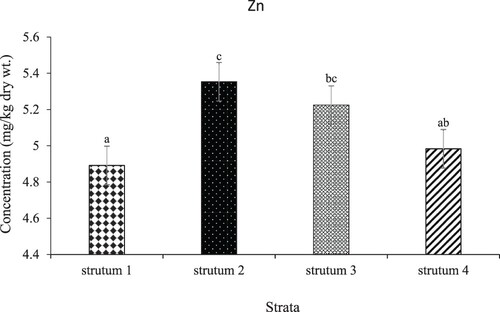
Table 2. Maximum Permissible Limit (MPL) of heavy metals in fish (mg/kg dry wt.) according to international standards.
Table 3. A comparison between estimated daily intake (EDI) and the recommended daily allowance (RDA) for males and females.
Data availability
The data used to support the findings and conclusions of this study are available within the manuscript.