Figures & data
Table 1. Components of Artemisia argyi essential oil.
Table 2. Clinical symptoms of broilers after nasal drops of AAEO at different concentrations.
Table 3. Clinical symptom rating scale.
Table 4. Real gene-specific oligonucleotide primer used for RT-qPCR.
Figure 1. Effect of AAEO on clinical parameters in broilers infected with IBV. The IBV and IBV + AAEO groups were infected with 104 EID50/0.2 mL IBV. After 3 days, the IBV + AAEO group received 0.3% AAEO (0.1 mL, nasal drop administration) per day for 7 consecutive days. Broilers in the AAEO group were given only 0.3% AAEO (0.1 mL, nasal drop administration), and the control group was not infected with a virus and was not given AAEO. The body weight of the broilers was measured, and the clinical symptom scores were evaluated and recorded. A: Average weight of the broilers between days 1 and 10 post-challenge (dead broilers weighing 0). B: Clinical symptom score of broilers. #P < 0.05, ##P < 0.01 versus the control group; *P < 0.05, **P < 0.01 versus the IBV group.
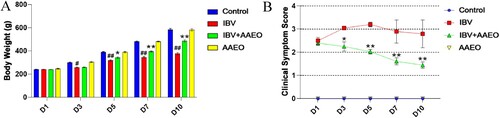
Table 5. Mortality statistics for each group during the study period.
Figure 2. Effect of AAEO on the lungs following IBV infection. On days 3, 7, and 10 post-challenge, the lungs were collected from eight broilers per group. The lung and body weights were measured, and the lung indices were calculated. IBV titers in the lung were determined via RT-qPCR. #P < 0.05, ##P < 0.01 versus the control group; *P < 0.05, **P < 0.01 versus the IBV group.
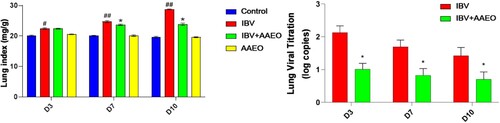
Figure 3. Histological and gross pathological effects of AAEO on the lungs and trachea were reflected by dissection and pathological sections via hematoxylin–eosin (HE) staining. Each group of broilers was randomly selected and sacrificed on day 7 post-challenge, and the lungs and trachea were dissected and fixed with formaldehyde and embedded in paraffin to create pathological sections. A: Pulmonary necropsy of each group after 10 days of the challenge. The length and width of the IBV-infected lungs were ∼2 mm shorter than those of normal broilers. Bleeding in the AAEO treatment group was reduced compared with that in the IBV group. B: Autopsy of the trachea in each group after 7 days of the challenge. There was severe bleeding with abundant purulent exudation in the IBV group. Bleeding was not apparent in the treatment group, but there was also substantial purulent exudation. C: Pulmonary pathological changes in each group, HE 100×. The lung tissue of the IBV group exhibited significant red blood cell spillage into the alveolar space (black arrows), whereas the alveolar morphology and structure of the other three groups were intact and no significant hemorrhage was observed. Hyperemia was more severe in the treatment group than in the control and AAEO groups. D: Pathological changes in the trachea in each group, HE 100×. In the IBV group, the mucosal layer was thickened with massive red blood cell spillage, and the submucosal layer was edematous. The mucosal layer was significantly thicker in the treatment group than in the control and AAEO groups.
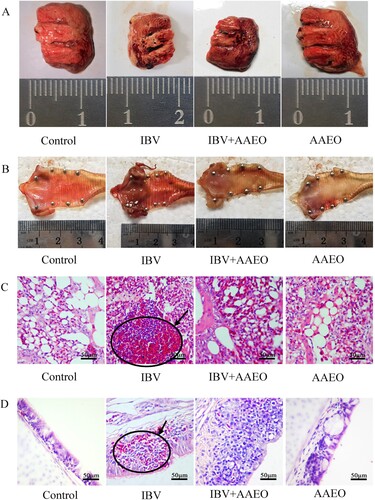
Figure 4. Effect of AAEO on the spleen following IBV infection. The spleens were collected from eight broilers per group on days 3, 7, and 10. The body weights were measured, and the lung indices were calculated. ##P < 0.01 versus the control group; *P < 0.05, **P < 0.01 versus the IBV group.
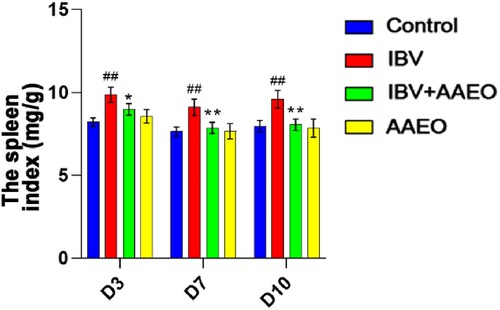
Figure 5. Effect of AAEO on the immune status of broilers infected with IBV. Tracheal sections were obtained from broilers on day 7. Tracheal wash fluid and serum were collected on days 3, 7, and 10, respectively. Tracheal sections were examined via immunohistochemistry, and antibody levels were detected via ELISA. A and B: Distribution and percentage of IgA+ cells in the trachea of broilers between the groups. IgA+ cells (red arrows) stained with yellow–brown. C: Antibody levels of broilers in different treatment groups. #P < 0.05, ##P < 0.01, ###P < 0.001 versus the control group; *P < 0.05, **P < 0.01, ***P < 0.001 versus the IBV group.
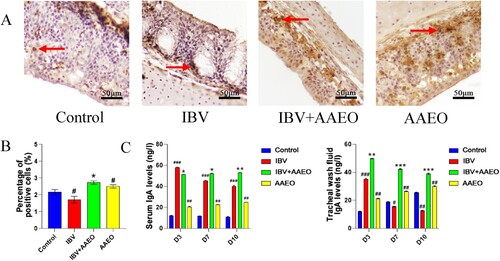
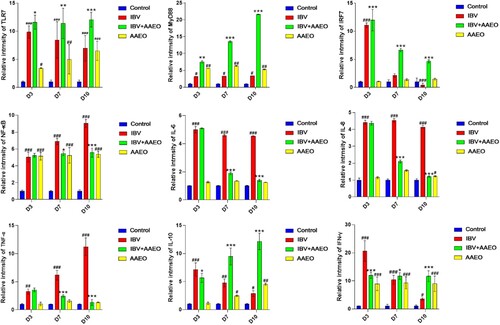
Figure 6. Effect of AAEO on cytokines in the trachea and lungs infected with IBV was examined using RT-qPCR. The trachea and lungs obtained on days 3, 7, and 10 were ground and lysed under frozen conditions for RNA extraction. #P < 0.05, ##P < 0.01, ###P < 0.001 versus the control group; *P < 0.05, **P < 0.01, ***P < 0.001 versus the IBV group.