
Figures & data
Figure 1. Schematic diagram of fecal sample collection sites of black-capped capuchins; The triangle marker is the fecal sample collection point.
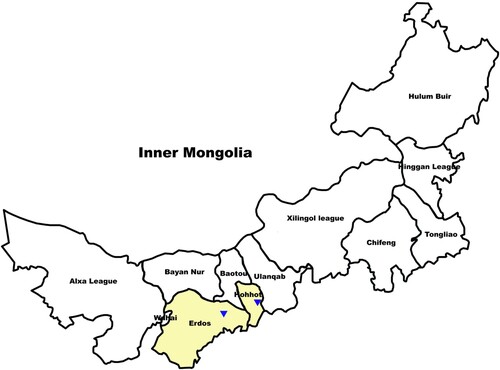
Table 1. Species composition of bacteria at different taxonomic levels.
Table 2. Analysis summary of α diversity index at different classification levels.
Figure 2. Cluster analysis of intestinal bacterial flora of black-capped capuchins in different regions.
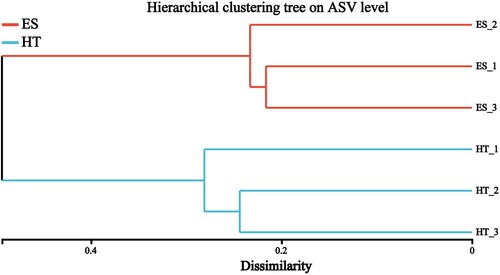
Figure 3. Circos plot of the composition of the intestinal bacterial community at different taxonomic levels; A, Phylum; B, Family; C, Genus.
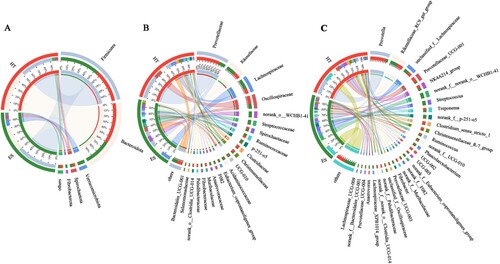
Figure 4. Analysis of differences and significance tests between species groups at different taxonomic levels; *P < 0.05 and **P < 0.01.
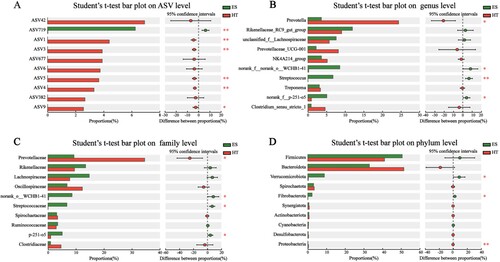
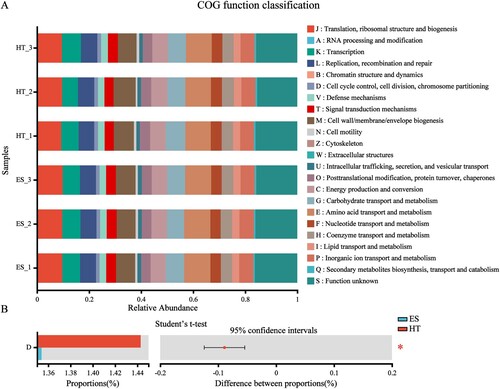
Figure 5. Functional classification statistics and difference test of metabolic genes in intestinal bacteria; A, COG functional abundance statistics; B, COG functional abundance Student’s t-test; *P < 0.05 and **P < 0.01.
Appendix_II_1
Download PDF (1.5 MB)Data Availability Statement
Genetic sequencing data (BioSample SAMN26816508, SAMN26816509, SAMN26816510, SAMN26816511, SAMN26816512, SAMN26816513) of six fecal samples from black-capped capuchin completed by Shanghai Majorbio Bio-Pharm Technology Co., Ltd, and this study is available in GenBank under BioProject number PRJNA818119.