
Figures & data
Table 1. Composition of scapula bone available on earth with various animals.
Figure 1. Scapula bone location for sheep and goats.
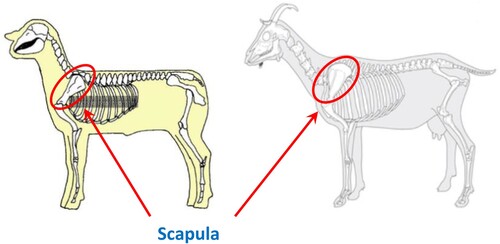
Figure 2. Scapula bone of Deccani sheep.
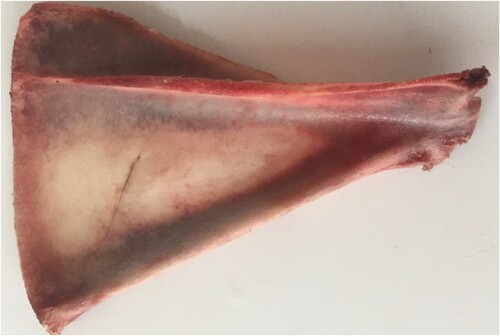
Figure 3. Thick-thin-medium portion on scapula bone.
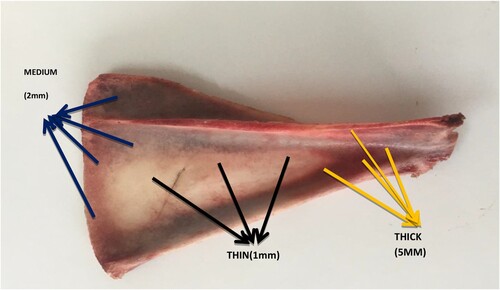
Figure 4. Experimental process methodology.
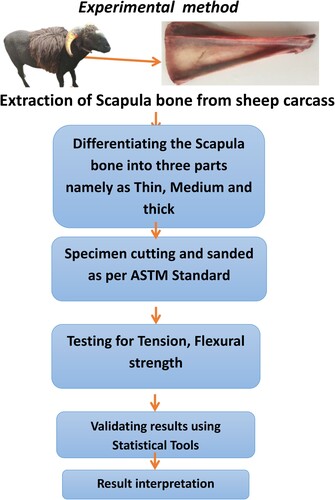
Table 2. Mechanical and physical properties of scapula bone in various available sources.
Figure 5. Coupons for tensile test.
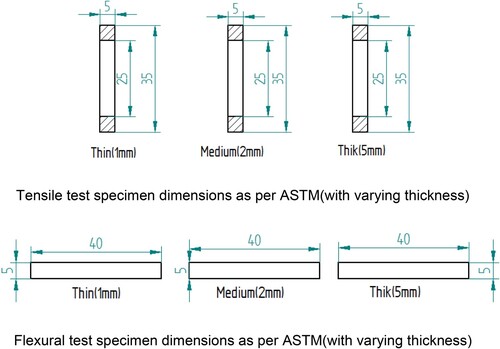
Figure 6. Stress–strain curve for all samples.
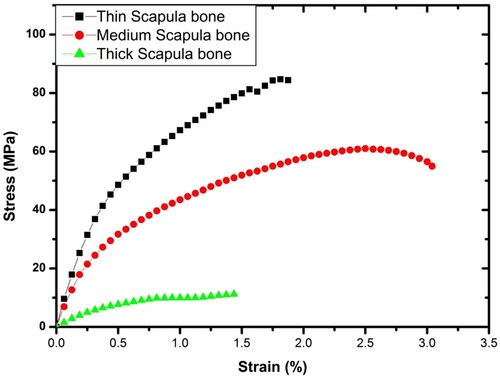
Figure 7. Mechanical properties yield strength and ultimate strength.
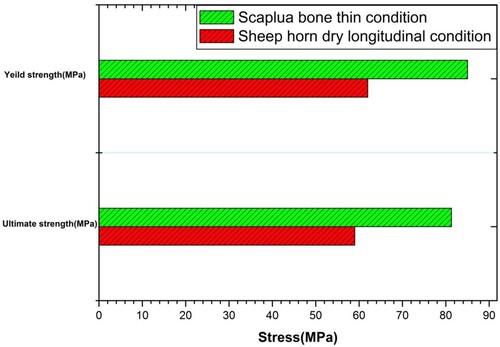
Table 3. Material properties of scapula bone with varied thickness.
Table 4. One-way ANOVA results on the tensile properties of Deccani sheep scapula bone.
Figure 8. Flexural modulus for thin, medium and thick condition specimen by three-point bend test.
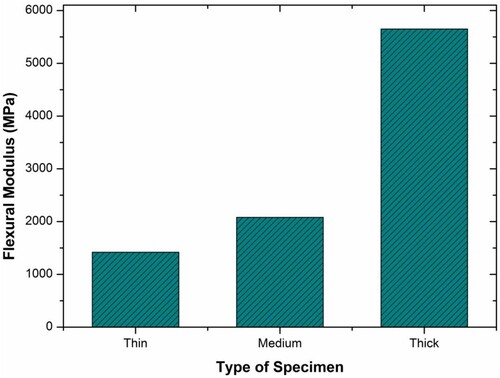
Figure 9. Maximum flexural strength for thin, medium and thick condition specimens by three-point bend test.
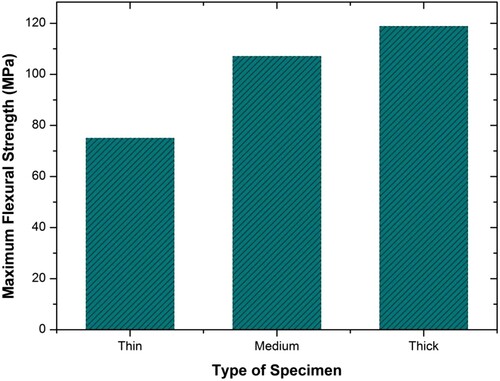
Table 5. Flexural properties of Deccani sheep scapula bone.
Table 6. One-way ANOVA results on the flexural properties of scapula bone of Deccani breed sheep.
Figure 10. Tensile strength model for 1 mm thickness.
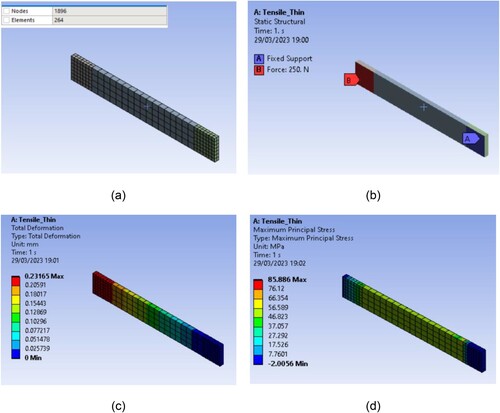
Figure 11. Tensile strength model for 2 mm thickness.
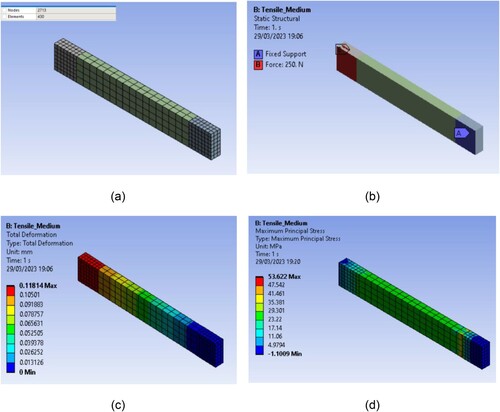
Figure 12. Tensile strength model for 5 mm thickness.
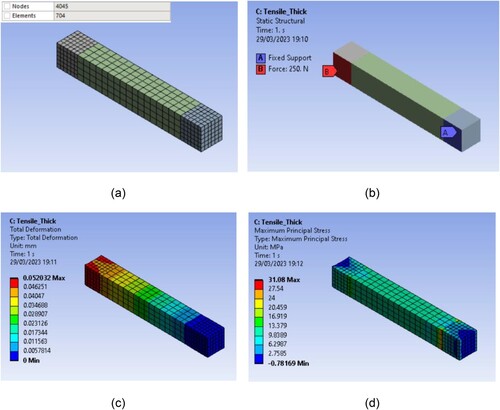
Figure 13. Flexural strength model for 1 mm thickness.
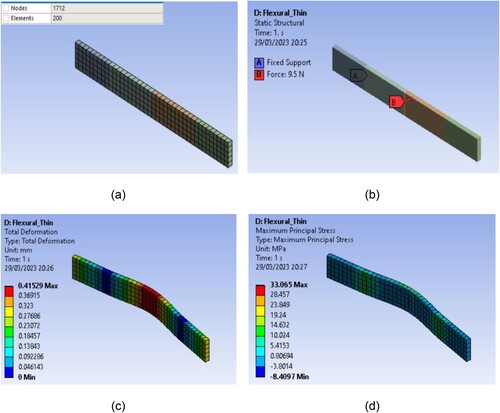
Figure 14. Flexural strength model for 2 mm thickness.
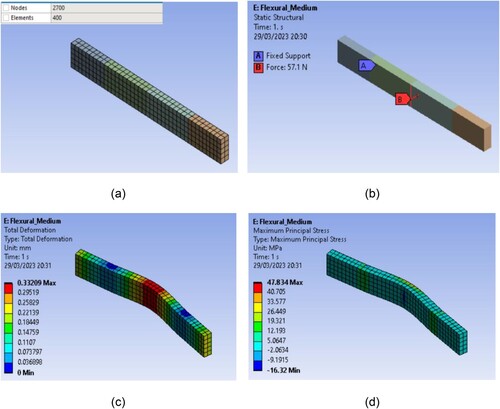
Figure 15. Flexural strength model for 5 mm thickness.
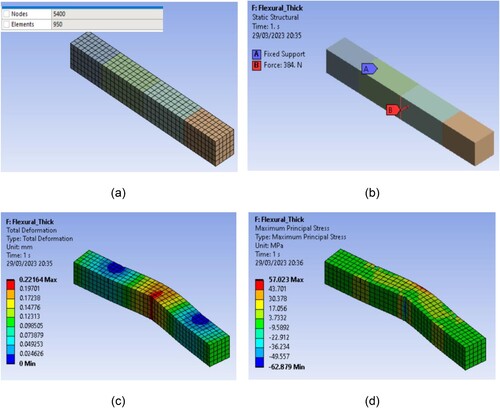
Table 7. Comparative data with tensile and flexural strength.