
Figures & data
Figure 1. Identification of C500/pVAX-asd-IS and C500. Marker: DNA molecular weight markers (DL-5000); C500/pVAX-asd-IS: the target fragment of C500/pVAX-asd-IS plasmids (794 bp); C500: C500 plasmids.
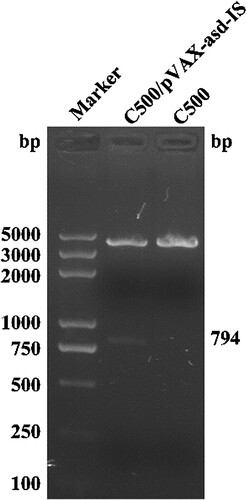
Figure 2. The P/N value of antibody against INH after primary immunization. Results were compared with the control group at each week and data are presented as the mean ± SEM (n = 10), * and ** indicate significant differences p <0.05 and p <0.01, respectively among groups.
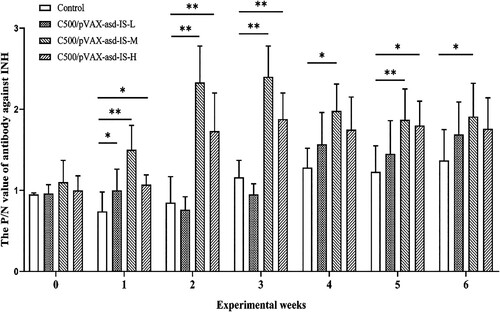
Figure 3. FSH concentrations in the serum of rats. Results were compared with the control group at each week and data are presented as the mean ± SEM (n = 10), * and ** indicate significant differences p <0.05 and p <0.01, respectively among groups.
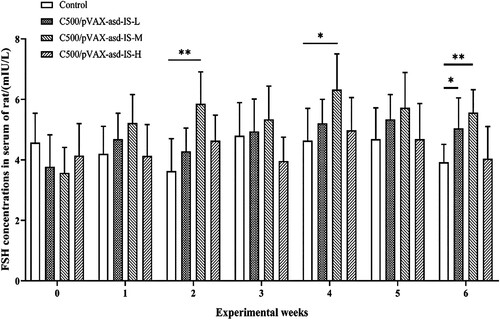
Figure 4. LH concentrations in the serum of rats. Results were compared with the control group at each week and data are presented as the mean ± SEM (n = 10), * and ** indicate significant differences p <0.05 and p <0.01, respectively among groups.
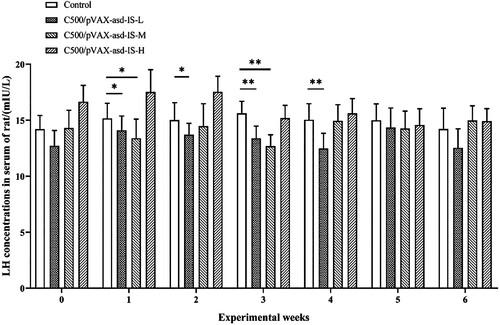
Figure 5. T concentrations in the serum of rats. Results were compared with the control group at each week and data are presented as the mean ± SEM (n = 10), * and ** indicate significant differences p <0.05 and p <0.01 respectively among groups.
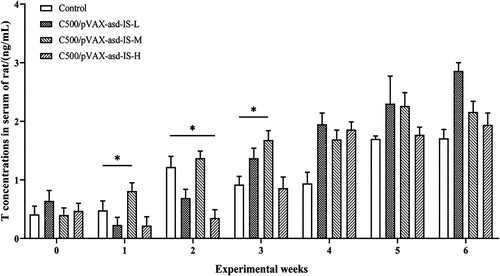
Figure 6. Effects of INH immunization on testicular weight (A), testicular volume (B), testis coefficient (C), epididymal weight (D), sperm count in the epididymis (E) and sperm deformity rate in the epididymis (F) of rats (%). Results were compared with the control group and data are presented as the mean ± SEM (n = 10), * and ** indicate significant differences p <0.05 and p <0.01, respectively among groups.
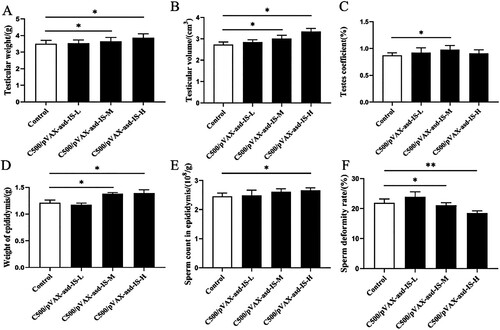
Figure 7. Effects of INH gene immunization on GGT (A), ALP (B), ACP (C), LDH (D), α-neutral glucosidase (E) and carnitine (F) levels of rat testes. Results were compared with the control group and data are presented as the mean ± SEM (n = 10), * and ** indicate significant differences p <0.05 and p <0.01, respectively among groups.
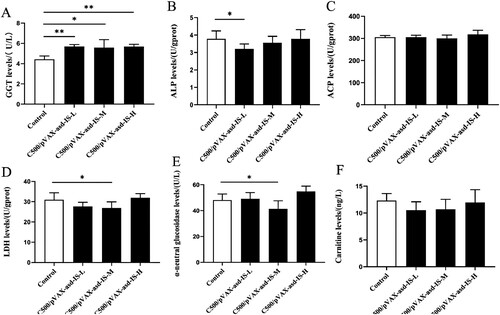
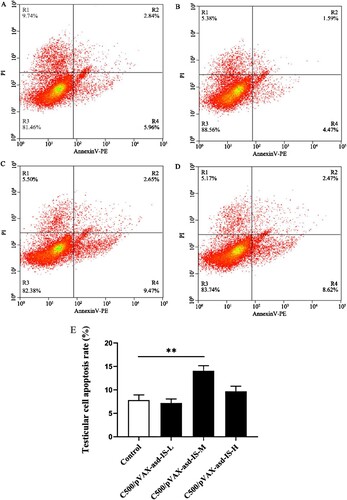
Figure 8. Percentage of testicular apoptotic cells in rats immunized with C500 (A), C500/pVAX-asd-IS-L (B), C500/pVAX-asd-IS-M (C) and C500/pVAX-asd-IS-H (D), which were analysed by flow-cytometry using Annexin V-PE/PI double staining. Quantitative analysis of apoptotic cells by Annexin V-PE/PI (E). Results were compared with the control group and data are presented as the mean ± SEM (n = 10), * and ** indicate significant differences p <0.05 and p <0.01, respectively among groups.
Data availability statement
The data that support the findings of this study are available on request from the corresponding author (Shuilian Wang), upon reasonable request.