
Figures & data
Table 1. Effects of feed supplemented with AM on organ index of laying hens.
Table 2. Effects of feed supplemented with AM on production performance of laying hens.
Table 3. Effects of feed supplemented with AM on pH of laying hens.
Table 4. Effects of feed supplemented with AM on muscle colour and shear force of laying hens.
Table 5. Effects of feed supplemented with AM on muscle dripping and cooking loss.
Table 6. Effects of feed supplemented with AM on egg quality of laying hens.
Figure 1. GC-MS total ion current chromatograms of egg yolks. Abbreviations: a: control group, b: LAM group, c: MAM group, d: HAM group.
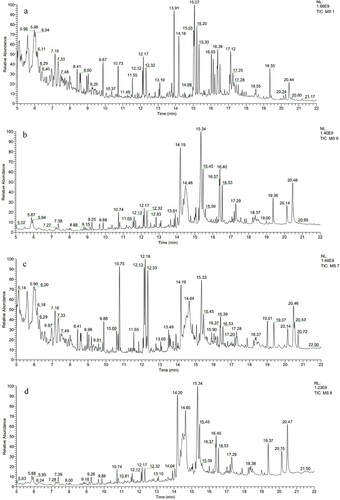
Table 7. Effects of feed supplemented with AM on volatile substances in yolk of laying hens.
Table 8. Effects of feed supplemented with AM on antioxidant parameters of laying hens.
Figure 2. Effects of AM on Liver and ovary antioxidant gene expression of laying hens. Note:a,b,c,d Different superscripts within a row indicate a significant difference (P < 0.05). Abbreviations: SOD1, Superoxide Dismutase 1, GPX1, Glutathione peroxidase 1, NQO1, NADPH: Quinone Oxidoreductase 1. Values are expressed as mean ± standard deviation (n = 6). Data are the mean of six replicates. Control: Basal diet, LAM: 1% of Aronia melanocarpa plus diet, MAM: 4% of Aronia melanocarpa plus diet, HAM: 7% of Aronia melanocarpa plus diet.
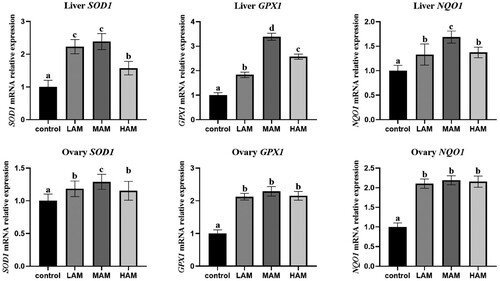
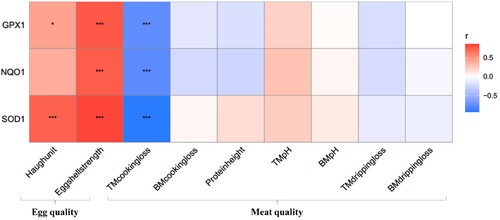
Figure 3. Correlation analysis of antioxidant genes in ovarian tissue with meat quality and egg quality. Abbreviations: GPX1, Glutathione peroxidase 1, NQO1, NADPH: Quinone Oxidoreductase 1, SOD1, Superoxide Dismutase 1. BM: Breast muscle, TM: Thigh muscle. Red: Positive correlation, Blue: Negative correlation. Values are expressed as mean ± standard deviation (n = 6). Data are the mean of six replicates. *P < 0.05, **P < 0.01, ***P < 0.001.
supplementary_figure_ion_concentration
Download Zip (5.8 MB)Supplementary_Table
Download MS Word (23.1 KB)Data availability statement
The results and analyses presented in this paper are freely available upon request.