Figures & data
Table 1. Aspects and elements of empowerment addressed in this study.
Table 2. Statements included in the gender attitudes scale of the WEFI.
Table 3. Demographic profiles of study participants (means or %).
Table 4. Mean gender attitude scores.
Table 5. Levels of involvement in fishing, processing, and trading fish.
Table 6. Levels of involvement in making ‘large input’ into household decisions about the income generated from fishing and processing and trading fish.
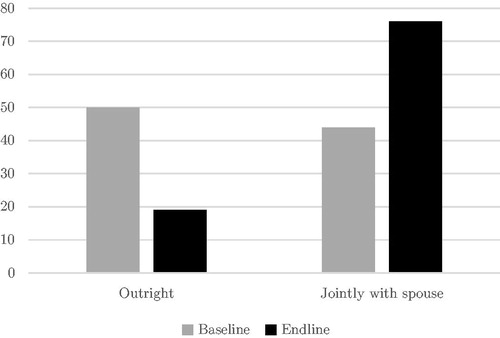
Figure 1. Changes in fishing gear ownership status of men from PGNA + GTC camps. Notes: PGNA + GTC = practical gender needs approach + gender transformative communication. 18 men at baseline and 21 at endline were included in the analysis. Both changes in ownership status from baseline to endline were statistically significant at the 5% level. Numbers on y-axis indicate percentages (%).