1,615
Views
14
CrossRef citations to date
0
Altmetric
Articles

Evolution of Pleistocene travertine depositional system from terraced slope to fissure-ridge in a mixed travertine-alluvial succession (Jebel El Mida, Gafsa, southern Tunisia)

ORCID Icon, , ORCID Icon, ORCID Icon &
Pages 20-41 | Received 22 May 2016, Accepted 23 Nov 2016, Published online: 12 Dec 2016

Figures & data

Figure 1. (A) Simplified geological map of the southern Atlas foreland in Tunisia (Gharbi et al., Citation2014). (B) Morphotectonic map of the Gafsa area derived from SPOT 5 satellite images analysis and field reconnaissance (Said et al., Citation2011). Cross-cutting striations recorded on the Gafsa Fault plane indicate the transpressional stress regime. (C) Stratigraphic column of the Mesozoic and Cenozoic series around Gafsa city showing the main hydrostratigraphic units (Gharbi et al., Citation2014).
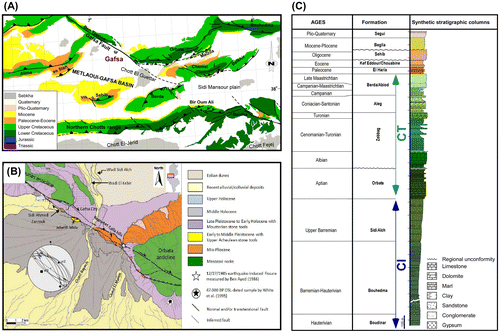
Figure 1. (A) Simplified geological map of the southern Atlas foreland in Tunisia (Gharbi et al., Citation2014). (B) Morphotectonic map of the Gafsa area derived from SPOT 5 satellite images analysis and field reconnaissance (Said et al., Citation2011). Cross-cutting striations recorded on the Gafsa Fault plane indicate the transpressional stress regime. (C) Stratigraphic column of the Mesozoic and Cenozoic series around Gafsa city showing the main hydrostratigraphic units (Gharbi et al., Citation2014).

Figure 2. (A) Well-defined linear north-west-facing scarp about 150-m long, 1–6-m high and trends 115° and dips about 70° NE. (B) Kinematic indicators mainly consist of mechanical striation (sacle bar = 20 cm). (C) Mineralised fault plane, Fe hydroxides and carbonates forming millimetre-thick crusts on the fault plane. (D) and (E) kinematic indicators consisting of sub-horizontal mechanical striation. (F) Heavy travertine incrustation of high-angle intersected fracture planes (scale bar 10 cm). (G) and (H) Stereographic diagrams (lower hemisphere, Schmidt diagram) of the kinematic data collected for the strike-slip faults indicating cross-cutting striations recorded on the fault plane indicate two distinct slip generations and thus two distinct stress regimes along the Jebel El Mida structure.
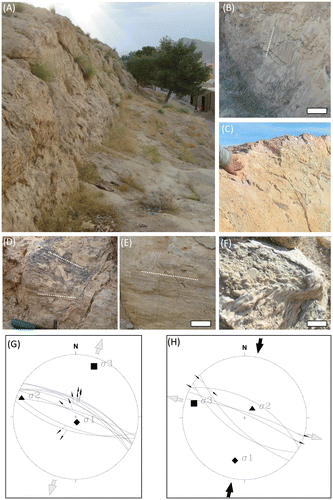
Figure 2. (A) Well-defined linear north-west-facing scarp about 150-m long, 1–6-m high and trends 115° and dips about 70° NE. (B) Kinematic indicators mainly consist of mechanical striation (sacle bar = 20 cm). (C) Mineralised fault plane, Fe hydroxides and carbonates forming millimetre-thick crusts on the fault plane. (D) and (E) kinematic indicators consisting of sub-horizontal mechanical striation. (F) Heavy travertine incrustation of high-angle intersected fracture planes (scale bar 10 cm). (G) and (H) Stereographic diagrams (lower hemisphere, Schmidt diagram) of the kinematic data collected for the strike-slip faults indicating cross-cutting striations recorded on the fault plane indicate two distinct slip generations and thus two distinct stress regimes along the Jebel El Mida structure.

Figure 3. (A) Simplified map of Jebel El Mida structure showing the main travertine outcrops and the mapped and the inferred faults. (B) The travertines of the eastern compartment of Jebel El Mida. (C) The travertines of the western compartment of Jebel El Mida. (D) The A–A′ cross-section in (A). (E) The cross-section of B-B′ in (A). (F) Panoramic view of the exposed succession in the structure of Jebel El Mida showing the location of the measured stratigraphic logs. (G) The stratigraphic logs with lithofacies grouped into lithofacies associations.
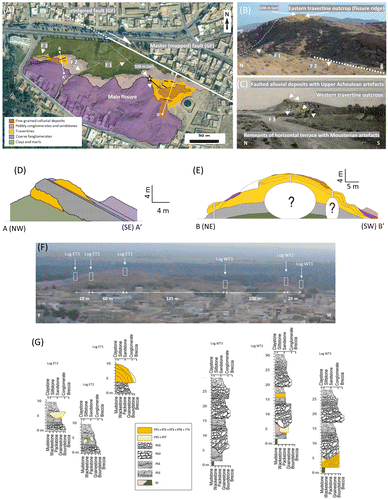
Figure 3. (A) Simplified map of Jebel El Mida structure showing the main travertine outcrops and the mapped and the inferred faults. (B) The travertines of the eastern compartment of Jebel El Mida. (C) The travertines of the western compartment of Jebel El Mida. (D) The A–A′ cross-section in (A). (E) The cross-section of B-B′ in (A). (F) Panoramic view of the exposed succession in the structure of Jebel El Mida showing the location of the measured stratigraphic logs. (G) The stratigraphic logs with lithofacies grouped into lithofacies associations.

Table 1. Description and interpretation of travertine lithofacies identified in the succession of Jebel El Mida.

Table 2. Description and interpretation of alluvial lithofacies identified in the succession of Jebel El Mida.

Figure 4. (A) Arborescent shrub-like morphology. (B) Calcite dendrite crystals growing on pool floor consisting densely laminated fabric. (C) Thin section photomicrographs of calcite crystals organised into a fan-shaped dentritic morphology. Crossed polarized light. (D) Layers of laminated boundstone locally disrupted by isolate sub-spherical to lenticular pores; the majority of them are trapped between dense laminated layers and thin undulated sheets of micrite. (E) Alternation of banded porous laminated boundstone composed of micrite and microsparite and dense laminated boundstone composed of dense micrite. (F) Laminated boundstone with drib lobe-like laminated structures. (G) Thin section photomicrographs of alternating layers of micrite (dark) and microsparite (white) laminae. Note that lamination may be observed within the laminae. (H) Raft boundstone/rudstone with thin film structures. Note the intra-raft porosity. (I) Coated bubble boundstone with hollow carbonate-coated microstructures. (J) Thin section photomicrograph of lithified gas bubbles with honeycomb-like porous structure. (K) Lithified gas bubbles showing linear distribution pattern. (L) Isolated lithified gas bubble with inner wall lined by scalenohedral sparite cement.
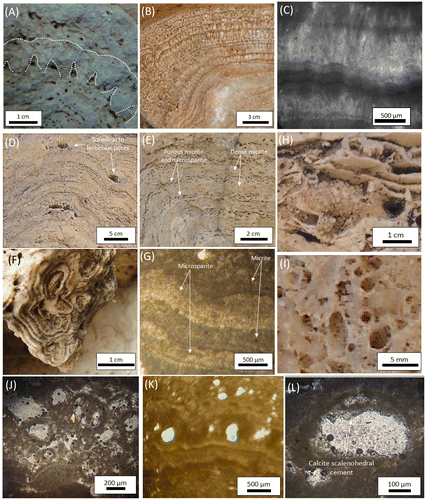
Figure 4. (A) Arborescent shrub-like morphology. (B) Calcite dendrite crystals growing on pool floor consisting densely laminated fabric. (C) Thin section photomicrographs of calcite crystals organised into a fan-shaped dentritic morphology. Crossed polarized light. (D) Layers of laminated boundstone locally disrupted by isolate sub-spherical to lenticular pores; the majority of them are trapped between dense laminated layers and thin undulated sheets of micrite. (E) Alternation of banded porous laminated boundstone composed of micrite and microsparite and dense laminated boundstone composed of dense micrite. (F) Laminated boundstone with drib lobe-like laminated structures. (G) Thin section photomicrographs of alternating layers of micrite (dark) and microsparite (white) laminae. Note that lamination may be observed within the laminae. (H) Raft boundstone/rudstone with thin film structures. Note the intra-raft porosity. (I) Coated bubble boundstone with hollow carbonate-coated microstructures. (J) Thin section photomicrograph of lithified gas bubbles with honeycomb-like porous structure. (K) Lithified gas bubbles showing linear distribution pattern. (L) Isolated lithified gas bubble with inner wall lined by scalenohedral sparite cement.

Figure 5. (A) Reed boundstone including stem and branch moulds; some of them are in their original upright position with heavy carbonate encrustation. (B) and (C) Coated grain (pisoïd) showing closely packed concentric to sub-concentric cortical laminae consisting of lamina couplets of dense dark and porous light micrite ranging in number from 10 to 20 dark laminae and 15 to 30 light laminae. (D) Aquatic insect larval tube boundstone consisting of calcified cylindrical insect larval tubes arranged in layers and oriented normal to bedding. (E) Details of one pyralid larval tube. Tube inner wall is lined with 0.1–0.5-mm-thick white dense micrite ring encased in a more thickly porous white micrite envelop.
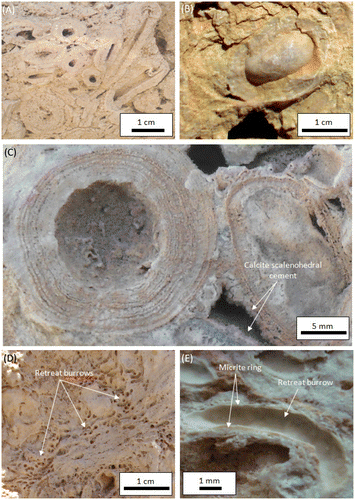
Figure 5. (A) Reed boundstone including stem and branch moulds; some of them are in their original upright position with heavy carbonate encrustation. (B) and (C) Coated grain (pisoïd) showing closely packed concentric to sub-concentric cortical laminae consisting of lamina couplets of dense dark and porous light micrite ranging in number from 10 to 20 dark laminae and 15 to 30 light laminae. (D) Aquatic insect larval tube boundstone consisting of calcified cylindrical insect larval tubes arranged in layers and oriented normal to bedding. (E) Details of one pyralid larval tube. Tube inner wall is lined with 0.1–0.5-mm-thick white dense micrite ring encased in a more thickly porous white micrite envelop.

Figure 6. Alluvial fan lithofacies. (A) Disorganised matrix-supported conglomerates (FT1) composed of matrix-supported sub-angular to sub-rounded and poorly sorted cobble-boulder clasts. (B) Conglomerates with structureless micrite and microsparite matrix. (C) Disorganised matrix- to clast-supported conglomerates (FT2). (D) Stratified sandstones (FTS1). Note that set and coset thicknesses of cross-strata average between 20 and 35 cm and 1 and 1.5 m, respectively, with low-angle cross-strata dipping from 15 to 25°. (E) Massive sandstones (FTS2). (F) Massive mudstones (FT3) with calcareous pedogenic nodules and reddish-brown claystones.
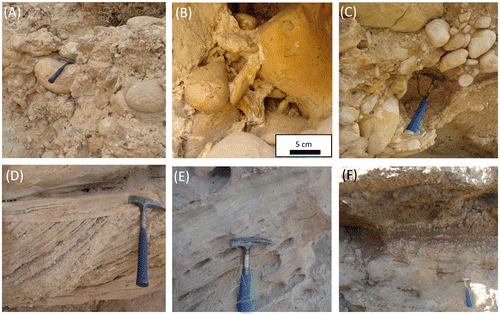
Figure 6. Alluvial fan lithofacies. (A) Disorganised matrix-supported conglomerates (FT1) composed of matrix-supported sub-angular to sub-rounded and poorly sorted cobble-boulder clasts. (B) Conglomerates with structureless micrite and microsparite matrix. (C) Disorganised matrix- to clast-supported conglomerates (FT2). (D) Stratified sandstones (FTS1). Note that set and coset thicknesses of cross-strata average between 20 and 35 cm and 1 and 1.5 m, respectively, with low-angle cross-strata dipping from 15 to 25°. (E) Massive sandstones (FTS2). (F) Massive mudstones (FT3) with calcareous pedogenic nodules and reddish-brown claystones.

Figure 7. Terraced slope travertine lithofacies association. (A) Discernible pools of terraced slope system with rims and walls oriented to the south-east and overlain by discharged coarse terrigenous materials. (B) and (C) Details of (A) showing the architecture of the travertine and the alluvial deposits.
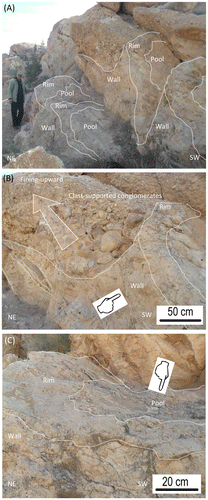
Figure 7. Terraced slope travertine lithofacies association. (A) Discernible pools of terraced slope system with rims and walls oriented to the south-east and overlain by discharged coarse terrigenous materials. (B) and (C) Details of (A) showing the architecture of the travertine and the alluvial deposits.

Figure 8. Fissure ridge travertine lithofacies association. (A) Uppermost denudated surfaces of the ridge. (B) Small-scale ephemeral pools with rims. (C) En-echelon and bifurcated parasitic fissure. (D) Crestal fissure showing banded travertines. (E) Eastern margins of the ridge showing lenses of travertines encased in former alluvial plain channelised streams. (F) Isolated rounded travertine slabs encased in pebbly to fine-grained sandstone facies. (G) Southward downslope margins of the ridge encased and overlain by coarse matrix- to clast-supported alluvial conglomerates. (H) North-eastern margins of the ridge show accumulations of porous travertine around parasitic fissures developed on matrix-supported gravels.
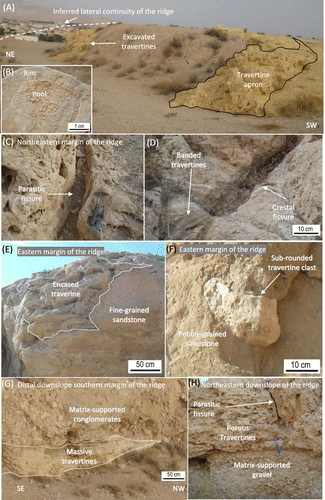
Figure 8. Fissure ridge travertine lithofacies association. (A) Uppermost denudated surfaces of the ridge. (B) Small-scale ephemeral pools with rims. (C) En-echelon and bifurcated parasitic fissure. (D) Crestal fissure showing banded travertines. (E) Eastern margins of the ridge showing lenses of travertines encased in former alluvial plain channelised streams. (F) Isolated rounded travertine slabs encased in pebbly to fine-grained sandstone facies. (G) Southward downslope margins of the ridge encased and overlain by coarse matrix- to clast-supported alluvial conglomerates. (H) North-eastern margins of the ridge show accumulations of porous travertine around parasitic fissures developed on matrix-supported gravels.

Figure 9. Alluvial fan lithofacies association. (A) Uplifted and extensively eroded fanglomerates and sandstones lithofacies. (B) and (C) Coarser fanglomerates with sandstone facies are developed as debris flows and streamflood deposits. (D) Alluvial deposits interfingering with travertines.
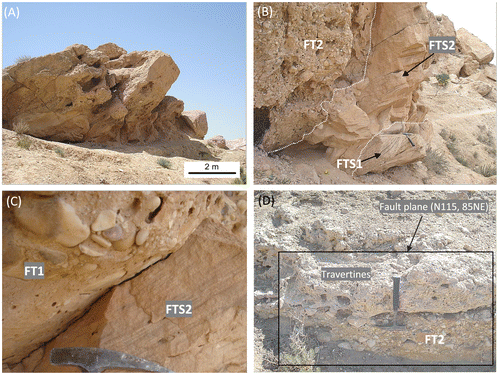
Figure 9. Alluvial fan lithofacies association. (A) Uplifted and extensively eroded fanglomerates and sandstones lithofacies. (B) and (C) Coarser fanglomerates with sandstone facies are developed as debris flows and streamflood deposits. (D) Alluvial deposits interfingering with travertines.

Figure 10. A possible paleoenvironmental reconstruction of the different depositional phases. See text for details. (A) Phase I, the development of terraced slop depositional system triggered by inherited extensional normal faults associated with the GF. (B) Phase II, characterised by the onset of alluvial discharge and the change of the tectonic regime from transtensional to transpressional fissure ridge travertine depositional system.
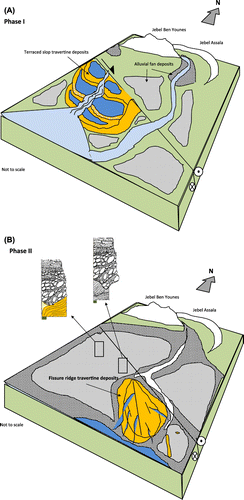
Figure 10. A possible paleoenvironmental reconstruction of the different depositional phases. See text for details. (A) Phase I, the development of terraced slop depositional system triggered by inherited extensional normal faults associated with the GF. (B) Phase II, characterised by the onset of alluvial discharge and the change of the tectonic regime from transtensional to transpressional fissure ridge travertine depositional system.

Figure 11. (A) Geochemical composition of Ain Cherfa (near Jebel Ben Younes) and Ain Soltan (near Jebel Orbata) (data provided by CRDA Gafsa). (B) Distribution pattern of the salinity in the groundwaters near Gafsa. (C) Piper plot of the water samples from Ain Cherfa and Ain Soltan. (D) Geothermal gradient map of Gafsa (modified from Ben Dhia, Citation1990).
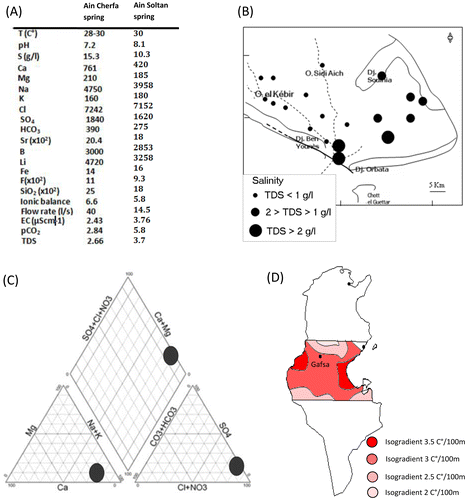
Figure 11. (A) Geochemical composition of Ain Cherfa (near Jebel Ben Younes) and Ain Soltan (near Jebel Orbata) (data provided by CRDA Gafsa). (B) Distribution pattern of the salinity in the groundwaters near Gafsa. (C) Piper plot of the water samples from Ain Cherfa and Ain Soltan. (D) Geothermal gradient map of Gafsa (modified from Ben Dhia, Citation1990).