1,327
Views
9
CrossRef citations to date
0
Altmetric
Articles

Numerical weather modeling-based slant tropospheric delay estimation and its enhancement by GNSS data

, &
Pages 186-200 | Received 22 Nov 2012, Accepted 09 May 2013, Published online: 13 Aug 2013

Figures & data

Table 1. Global numerical weather modeling products.

Figure 1 UK Met Office UM NAE model coverage.

Table 2. Relationship between the height and depth of the homogeneous thin layers in ray-tracing.

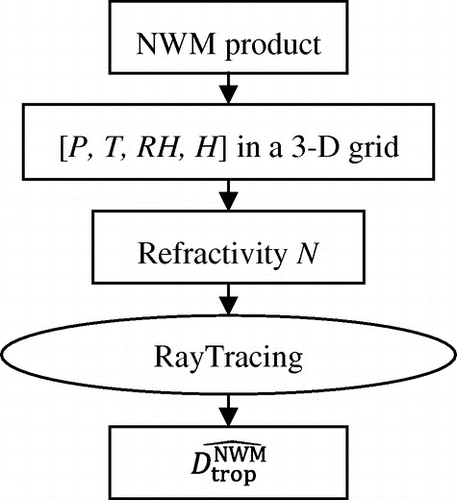
Figure 2 Flowchart of STD estimation from NWM product.

Figure 2 Flowchart of STD estimation from NWM product.

Figure 3 An example of slant troposphere delay (STD) and its NWM-based estimation residual against time.
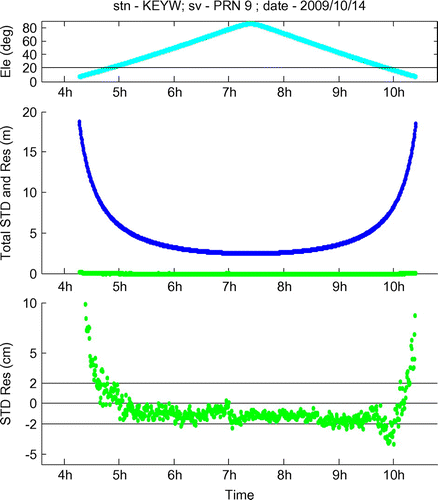
Figure 4 RMS of NWM-based STD estimation residual against observation elevation. (left (green) column – analysis field, right (red) column – forecast field).
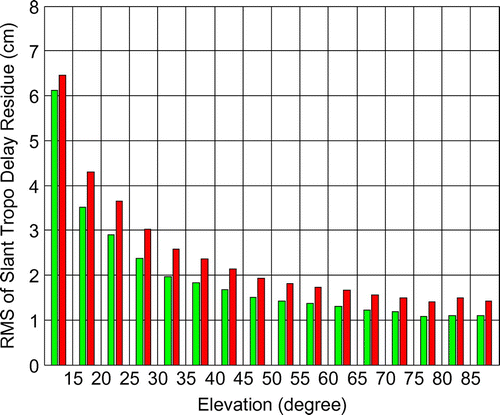
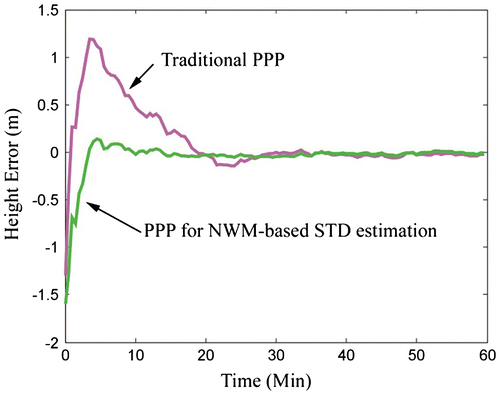
Figure 5 PPP convergence performance comparison.

Figure 6 Examples of NWM-based STD estimation residual. (green – from analysis field; red – from forecast field).
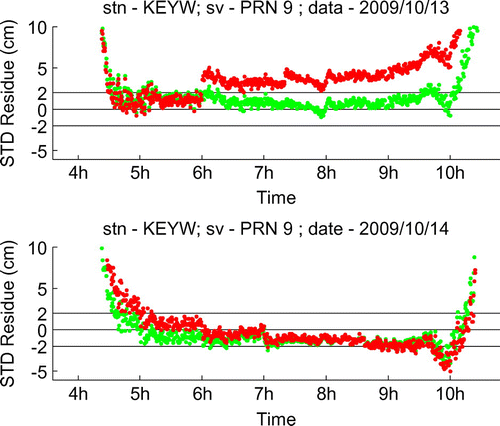
Figure 7 Examples of epoch-wise STD residual RMS. (greed – from analysis field; red – from forecast field).
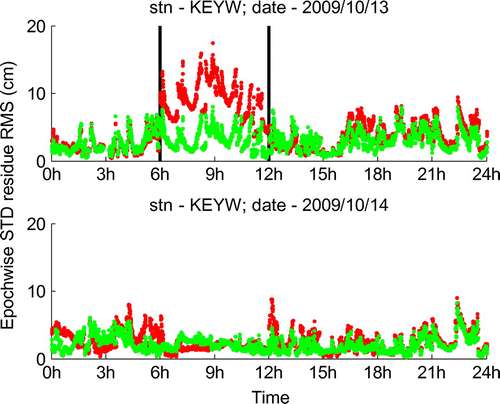
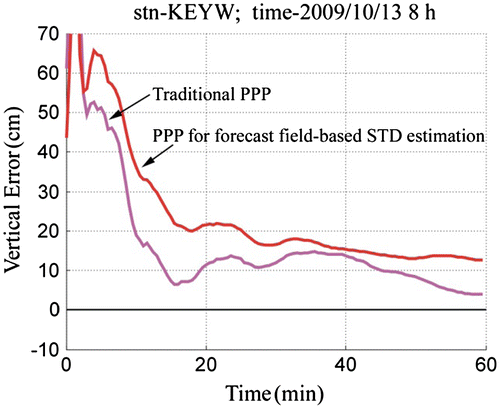
Figure 8 Example of PPP convergence performances on a troposphere condition active variation hour.

Figure 9 Another Example of PPP convergence performances on a troposphere condition quiet variation hour.
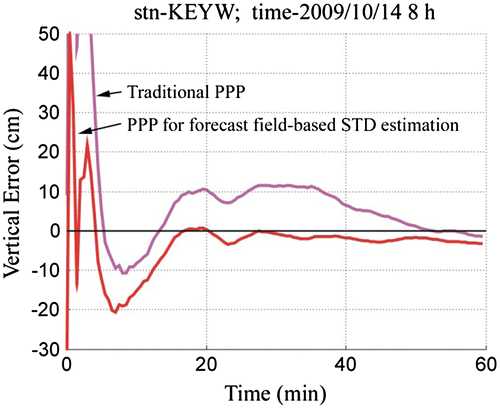
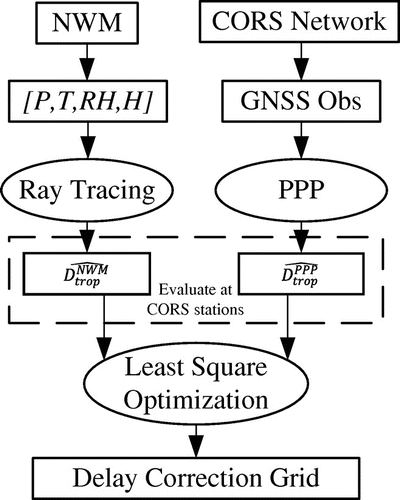
Figure 10 NWM-based and CORS observations-based methods.

Figure 10 NWM-based and CORS observations-based methods.

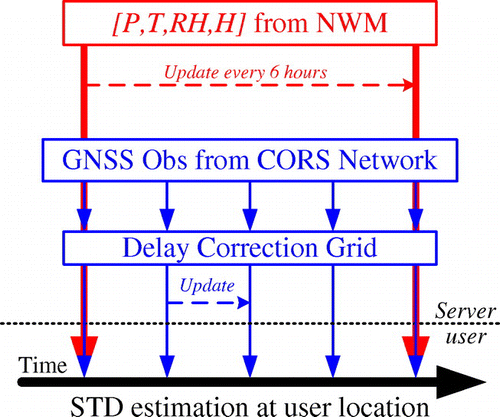
Figure 11 Timeline of the NWM and the correction grid data transmission.

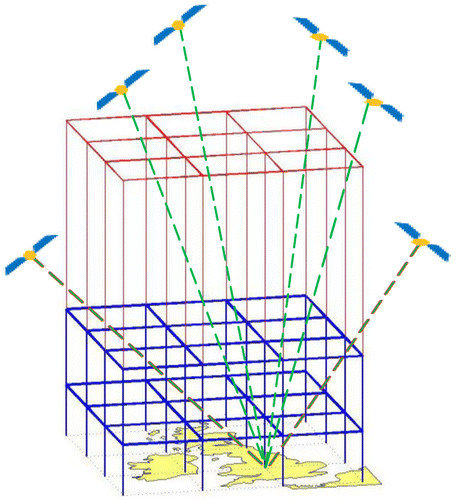
Figure 12 CORS observations “probing” through the NWM correction grids.

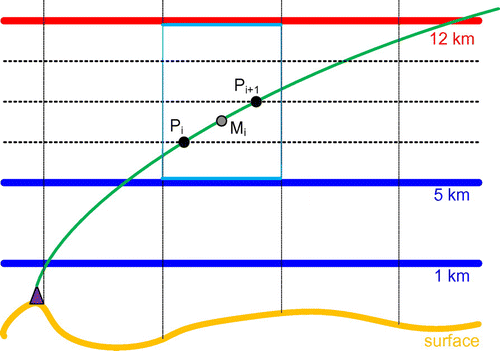
Figure 13 Front view of a signal piercing through the correction grid.

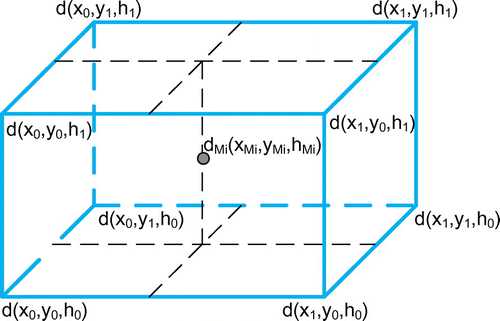
Figure 14 Linear interpolation within a voxel.

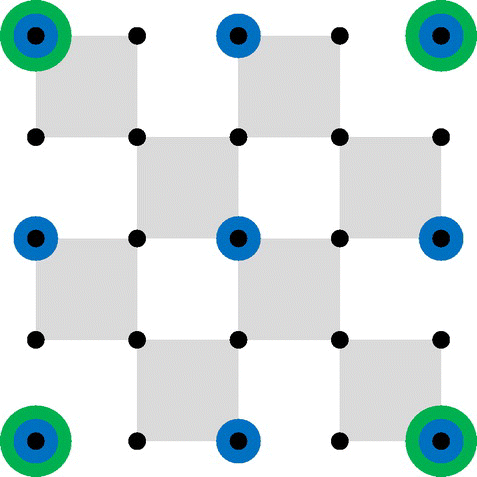
Figure 15 Illustration of multiple correction sets with different horizontal resolutions.

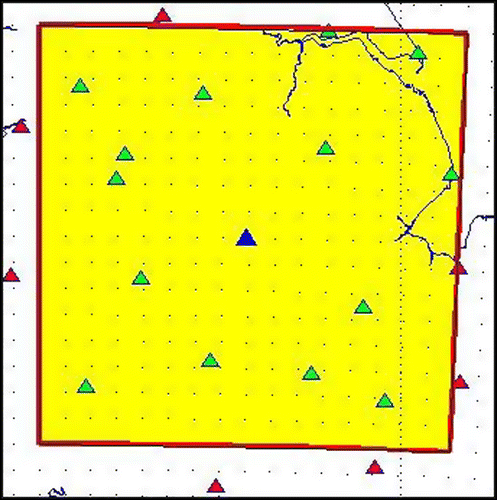
Figure 16 Test area in East Midlands, UK.

Table 3. Average number of qualified observations per epoch in the test area for the multi-GNSSs.

Table 4. Number of points to be solved in each correction round.
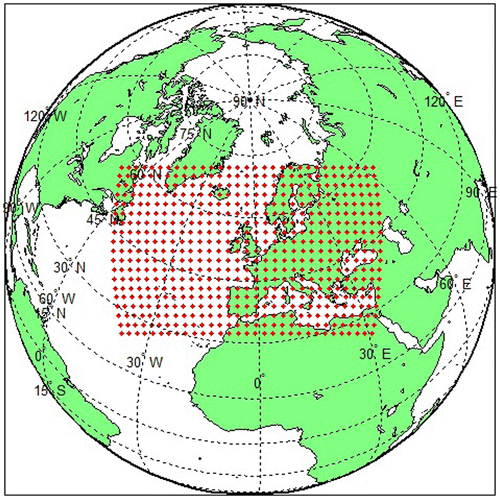
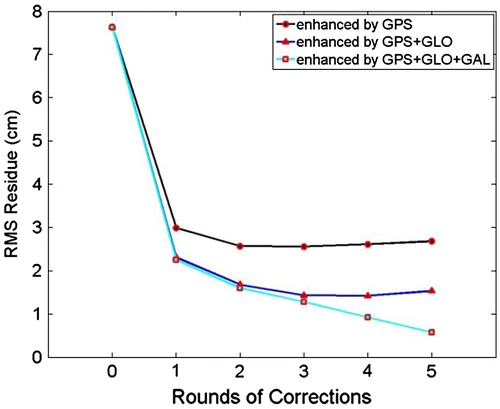
Figure 17 Improvement of multiple rounds of corrections on the RMS residuals for multi-GNSSs.

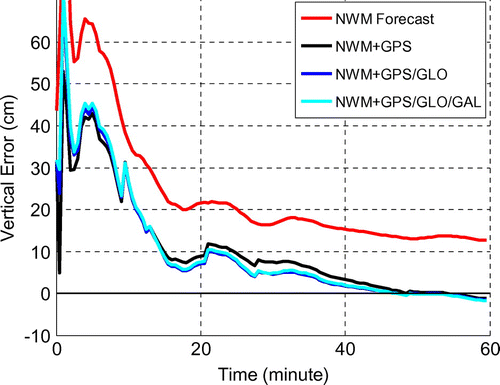
Figure 18 Multi-GNSS comparison on the PPP performance with the integrated STD estimation.

Reprints and Corporate Permissions

Please note: Selecting permissions does not provide access to the full text of the article, please see our help page How do I view content?

To request a reprint or corporate permissions for this article, please click on the relevant link below:

Academic Permissions

Please note: Selecting permissions does not provide access to the full text of the article, please see our help page How do I view content?

Obtain permissions instantly via Rightslink by clicking on the button below:

If you are unable to obtain permissions via Rightslink, please complete and submit this Permissions form. For more information, please visit our Permissions help page.