3,183
Views
44
CrossRef citations to date
0
Altmetric
Articles

Latent spatio-temporal activity structures: a new approach to inferring intra-urban functional regions via social media check-in data

, , , , , , & show all
Pages 94-105 | Received 12 Jan 2016, Accepted 29 Feb 2016, Published online: 17 May 2016

Figures & data

Figure 1. Study area (Shanghai, China) (a), and spatial distribution of check-in data by activities (b).
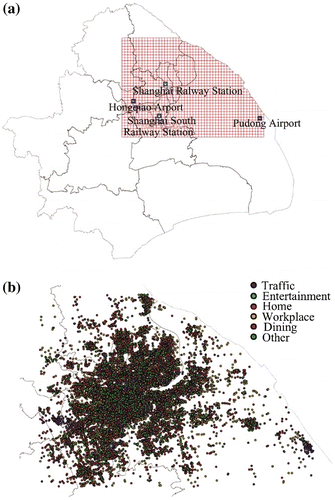
Figure 1. Study area (Shanghai, China) (a), and spatial distribution of check-in data by activities (b).

Figure 2. Flow chart of the proposed method.

Figure 2. Flow chart of the proposed method.

Figure 3. Region-TTD matrix.

Figure 3. Region-TTD matrix.

Figure 4. Distribution of singular values.

Figure 4. Distribution of singular values.

Figure 5. Reconstruction accuracy compared with the observed matrix.

Figure 5. Reconstruction accuracy compared with the observed matrix.

Figure 6. Reconstruction accuracy compared to original temporal variation of travel demands.

Figure 6. Reconstruction accuracy compared to original temporal variation of travel demands.

Figure 7. TTD characteristics of the top six LSTAS.

Figure 7. TTD characteristics of the top six LSTAS.

Figure 8. Spatial distributions of the top six LSTAS.

Figure 8. Spatial distributions of the top six LSTAS.

Figure 9. Cluster validity indices of the K-means algorithm via (a) Dunn’s and Silhouette index, and (b) Davies-Bouldin index.
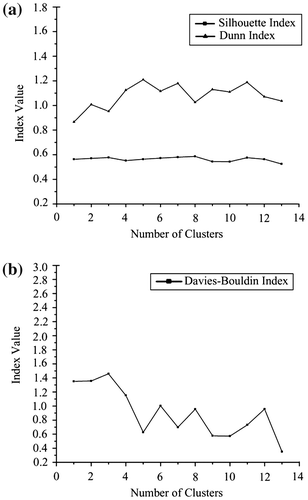
Figure 9. Cluster validity indices of the K-means algorithm via (a) Dunn’s and Silhouette index, and (b) Davies-Bouldin index.

Figure 10. Similarities among each TTD and centers of the 5 Clusters. (a) Cluster #1; (b) Cluster #2; (c) Cluster #3; (d) Cluster #4. (e) Cluster #5.

Figure 10. Similarities among each TTD and centers of the 5 Clusters. (a) Cluster #1; (b) Cluster #2; (c) Cluster #3; (d) Cluster #4. (e) Cluster #5.

Figure 11. Result of region aggregation and concentric urban form revealed by 5 Clusters. (a) six circles with the radii from 1 to17 km; (b) proportions of various clusters in zones.

Figure 11. Result of region aggregation and concentric urban form revealed by 5 Clusters. (a) six circles with the radii from 1 to17 km; (b) proportions of various clusters in zones.