Figures & data
Figure 1. Our rigid body node contains internal function nodes (blue) and variable nodes (red). Other nodes connect similarly to the green function node (left).
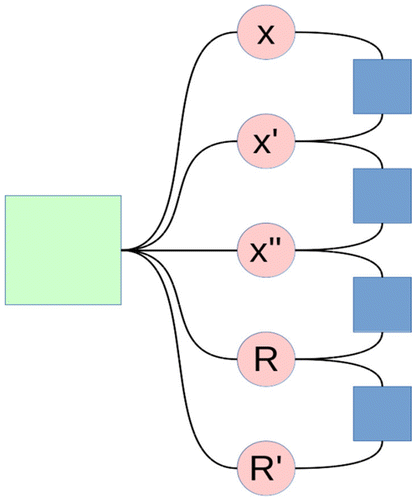
Figure 2. Illustration of graph generated using our technique.
Note: Rigid body nodes in blue and sensor measurement nodes in orange.
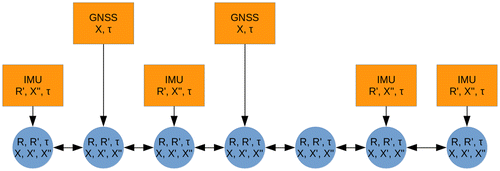
Table 1. Standard deviations used for simulated data.
Table 2. Calibration parameters for sensors.
Table 3. Measured standard deviation (SD) of sensors
Figure 3. Performance vs. number of threads.
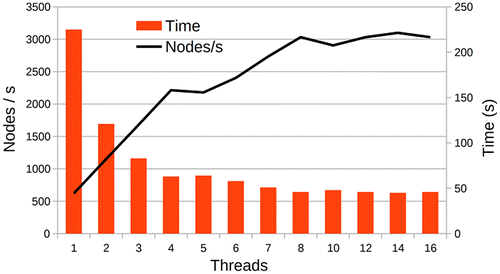
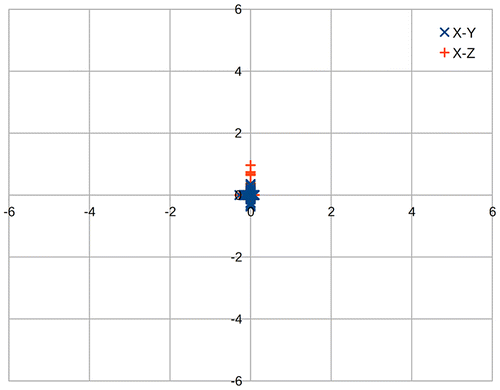
Figure 4. Scatter plot of calculated positions of the sensor platform x-axis (horizontal) y/z-axis vertical.
Note: X-Y positions are shown as X marker and X-Z positions are shown as + marker.
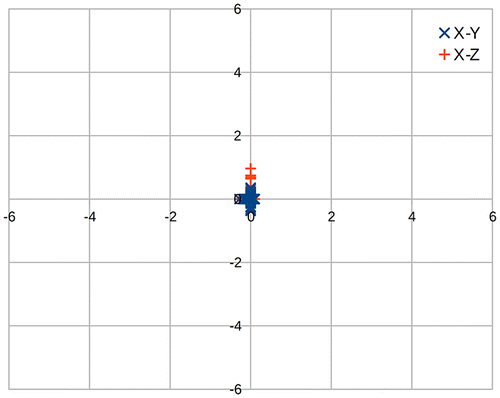
Figure 5. Plot of calculated positions for real data.
Note: x-axis (horizontal) y/z-axis vertical. X-Y positions are shown as X marker and X-Z positions are shown as + marker.
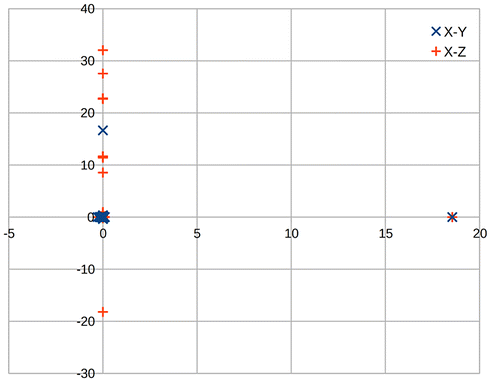
Figure 6. Plot of calculated positions for real data.
Note: x-axis (horizontal) y/z-axis vertical. X-Y positions are shown as X marker and X-Z positions are shown as + marker.