
Figures & data
Figure 1. Aerial map from Bing Maps© with blue rectangles highlighting zones that have been recently transformed.
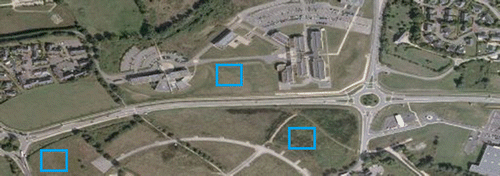
Figure 2. Flowchart of the proposed method.
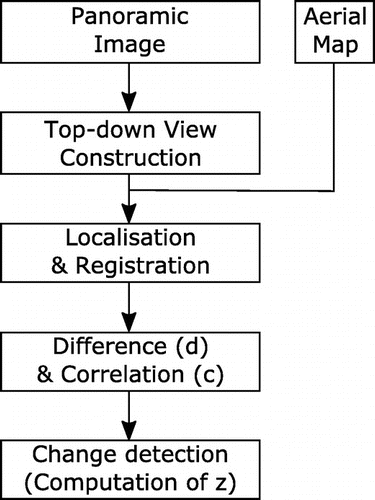
Figure 3. Example of a top down-view T (b) constructed from a panorama image P (a).
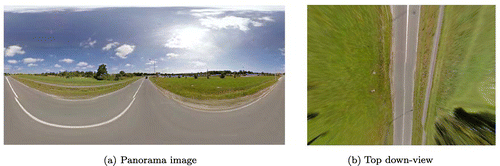
Figure 4. Standard object recognition and localization process.
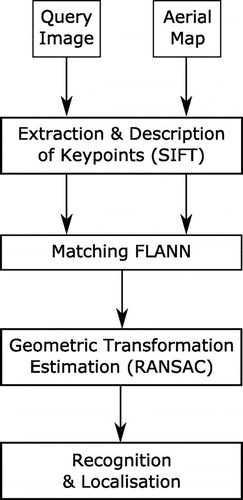
Figure 5. Example of top-down view localization in the aerial image. The top-down view T (a) is compared with the large aerial image A (b), and the green area denotes the found localization of T.
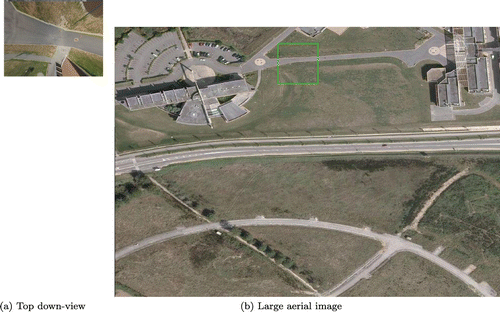
Figure 6. Panorama images used in experimental evaluation.
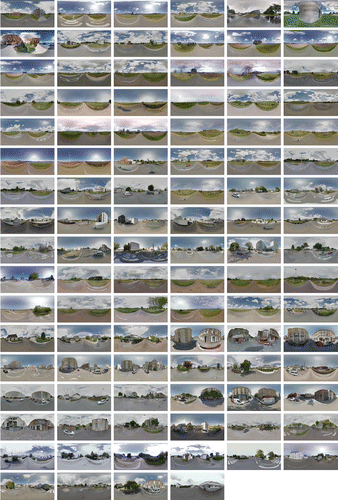
Figure 7. Aerial images used in experimental evaluation.
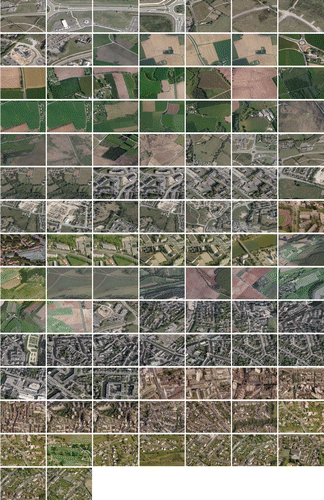
Figure 8. Artifacts brought by built-up structures (from top to bottom): missed changed, false changes due to other structured objects, false changes due to deformation brought by top-down view. For each line are given (from left to right): ground panorama, top-down view, and corresponding aerial image.
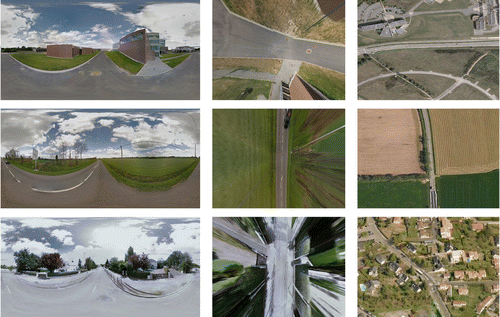
Table 1. Confusion matrix for the changed/unchanged classification.
Table 2. Confusion matrix for the unchanged/changed/structured classification.
Table 3. Computational complexity of the different steps composing our proposed approach. CPU times have been averaged among 100 runs.