3,691
Views
28
CrossRef citations to date
0
Altmetric
Articles

The OpenStreetMap folksonomy and its evolution

ORCID Icon, ORCID Icon &
Pages 219-230 | Received 02 Jun 2017, Accepted 05 Aug 2017, Published online: 18 Sep 2017

Figures & data

Figure 1. Comparison of the use of a tag in the OSM database and its first documentation in the OSM wiki. (a) First use of the tag in the data. (b) 100th use of the tag in the data. (c) 1% of the current use of the tag in the data. (d) 10% of the current use of the tag in the data. Each blue disk represents a tag, and the size of the disk reflects how frequently the tag is used in the OSM database. Only tags that are used at least 1000 times in the data and that are documented in the OSM wiki are included, tags with value "*" are excluded. Data from the OSM database/wiki Open StreetMap contributors (cf. http://openstreetmap.org/copyright and http://wiki.openstreetmap.org/wiki/Wiki_content_license).
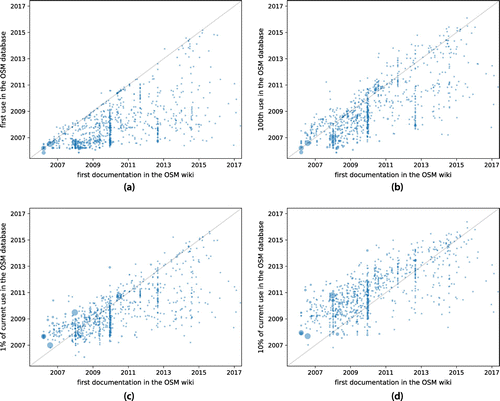
Figure 1. Comparison of the use of a tag in the OSM database and its first documentation in the OSM wiki. (a) First use of the tag in the data. (b) 100th use of the tag in the data. (c) 1% of the current use of the tag in the data. (d) 10% of the current use of the tag in the data. Each blue disk represents a tag, and the size of the disk reflects how frequently the tag is used in the OSM database. Only tags that are used at least 1000 times in the data and that are documented in the OSM wiki are included, tags with value "*" are excluded. Data from the OSM database/wiki Open StreetMap contributors (cf. http://openstreetmap.org/copyright and http://wiki.openstreetmap.org/wiki/Wiki_content_license).

Figure 2. Completeness of the documentation of the tags in the OSM wiki. (a) First use of the tag in the data. (b) 100th use of the tag in the data. (c) 1% of the current use of the tag in the data. (d) 10% of the current use of the tag in the data. The depicted completeness refers to how many tags of the currently documented tags have or have not, at a given point in time, been documented, despite having already been introduced in the data (first/100th/etc. use). The documentation is necessarily 100% complete at the current date, because only tags that are documented in the OSM wiki and that are used at least 1000 times in the data are considered in the population of the statistics. Tags with value "*" are excluded. Data from the OSM wiki OpenStreetMap contributors (cf. http://wiki.openstreetmap.org/wiki/Wiki_content_license).
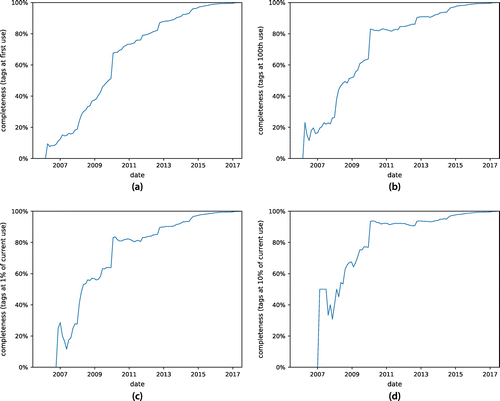
Figure 2. Completeness of the documentation of the tags in the OSM wiki. (a) First use of the tag in the data. (b) 100th use of the tag in the data. (c) 1% of the current use of the tag in the data. (d) 10% of the current use of the tag in the data. The depicted completeness refers to how many tags of the currently documented tags have or have not, at a given point in time, been documented, despite having already been introduced in the data (first/100th/etc. use). The documentation is necessarily 100% complete at the current date, because only tags that are documented in the OSM wiki and that are used at least 1000 times in the data are considered in the population of the statistics. Tags with value "*" are excluded. Data from the OSM wiki OpenStreetMap contributors (cf. http://wiki.openstreetmap.org/wiki/Wiki_content_license).
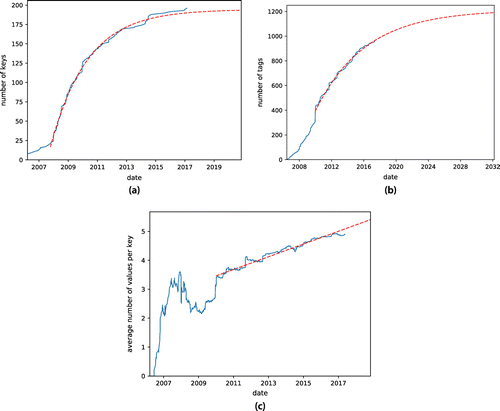
Figure 3. Evolution of the keys and values over time. (a) Keys. (b) Tags (key-value pairs). (c) Values per key. The actual data are depicted by a solid blue line, and the fits, by a dashed red line. Figures (a) and (b) are fitted by the function , and (c) by a linear function. Keys and tags with value "*" are excluded. Data from the OSM wiki OpenStreetMap contributors (cf. http://wiki.openstreetmap.org/wiki/Wiki_content_license).
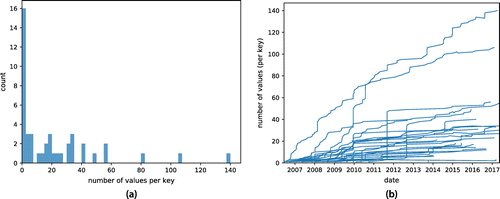
Figure 3. Evolution of the keys and values over time. (a) Keys. (b) Tags (key-value pairs). (c) Values per key. The actual data are depicted by a solid blue line, and the fits, by a dashed red line. Figures (a) and (b) are fitted by the function , and (c) by a linear function. Keys and tags with value "*" are excluded. Data from the OSM wiki OpenStreetMap contributors (cf. http://wiki.openstreetmap.org/wiki/Wiki_content_license).
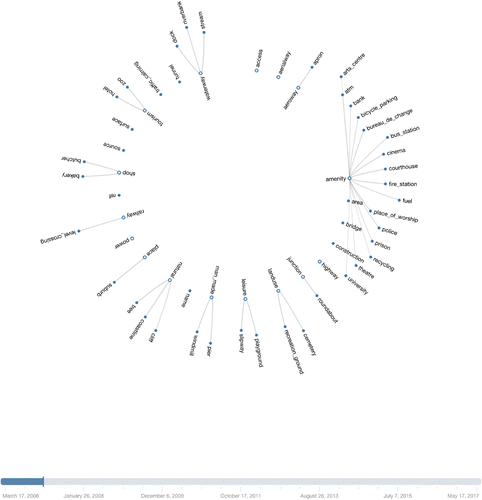
Figure 4. Values per key. (a) Histogram of the values per key. (b) Values per key. Keys with value "*" are excluded. Data from the OSM wiki OpenStreetMap contributors (cf. http://wiki.openstreetmap.org/wiki/Wiki_content_license).
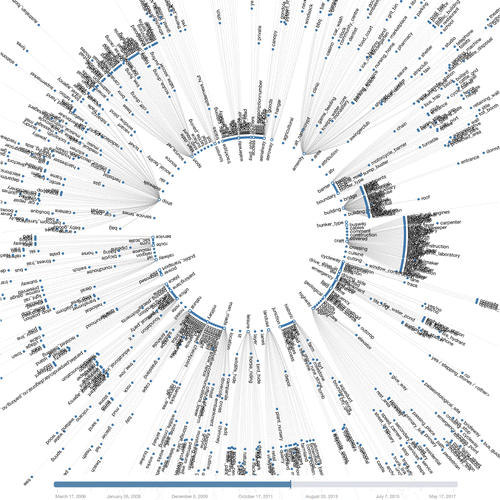
Figure 4. Values per key. (a) Histogram of the values per key. (b) Values per key. Keys with value "*" are excluded. Data from the OSM wiki OpenStreetMap contributors (cf. http://wiki.openstreetmap.org/wiki/Wiki_content_license).

Table 1. Phases in the evolution of the OSM folksonomy.

Figure 5. Visualization technique for the documentation of the folksonomy in the OSM wiki in 2007. The nodes of the inner circle refer to the documented keys, while the nodes around, to the corresponding values. The longer a value exists, the more it moves away from the origin. Data from the OSM wiki OpenStreetMap contributors (cf. http://wiki.openstreetmap.org/wiki/Wiki_content_license).

Figure 5. Visualization technique for the documentation of the folksonomy in the OSM wiki in 2007. The nodes of the inner circle refer to the documented keys, while the nodes around, to the corresponding values. The longer a value exists, the more it moves away from the origin. Data from the OSM wiki OpenStreetMap contributors (cf. http://wiki.openstreetmap.org/wiki/Wiki_content_license).

Figure 6. Visualization technique for the documentation of the folksonomy in the OSM wiki in 2012. Compare Figure . Data from the OSM wiki OpenStreetMap contributors (cf. http://wiki.openstreetmap.org/wiki/Wiki_content_license).

Figure 6. Visualization technique for the documentation of the folksonomy in the OSM wiki in 2012. Compare Figure 5. Data from the OSM wiki OpenStreetMap contributors (cf. http://wiki.openstreetmap.org/wiki/Wiki_content_license).