Figures & data
Figure 1. Pokémon-related point data-sets (a) around Downtown Miami and (b) in Hialeah.
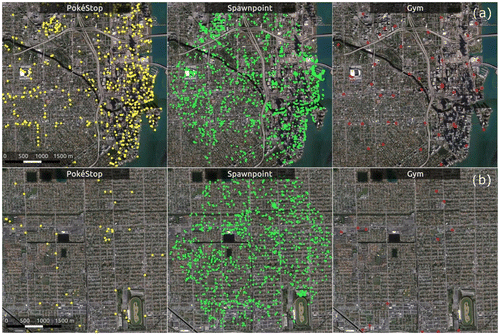
Figure 2. Study areas in (a) South Florida and (b) Boston, MA.
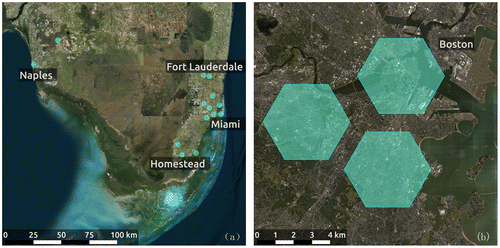
Figure 3. Example of scanned area for extracting Pokémon Go point data-sets in Miami Beach.
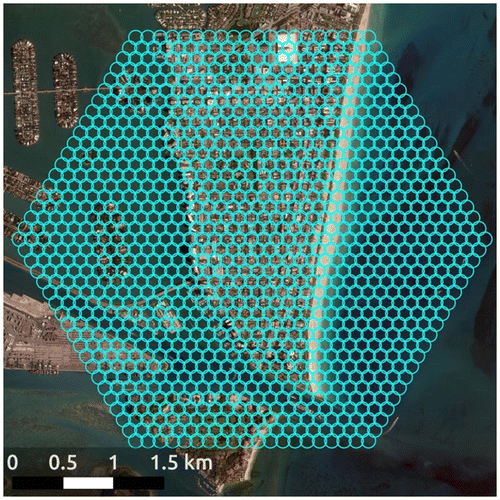
Figure 4. Scanning for Yelp businesses in part of Miami-Dade County, FL.
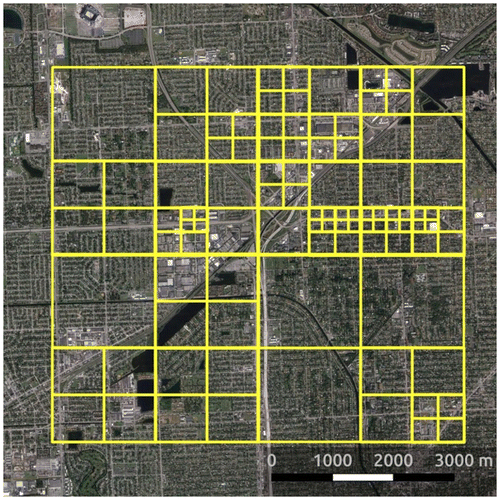
Table 1. Estimation results for the number of PokéStops.
Table 2. Pokémon Go-related point data-set counts on different land-use categories along with expected counts calculated based on area.
Figure 5. Relative count index for different land-use categories.
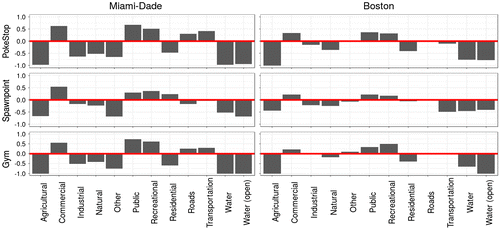
Figure 6. Computed Cross K-function (black line) with simulation mean (red dashed line) and confidence envelopes (gray area) for random labeling using a Monte Carlo simulation with 999 permutations.
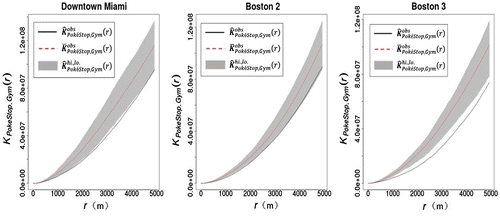
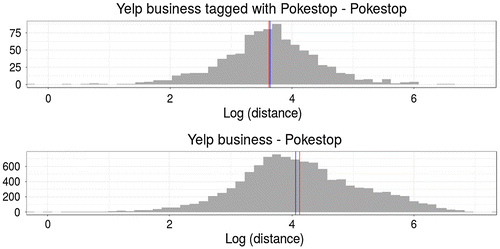
Table 3. Descriptive statistics of nearest neighbor distances between Yelp businesses and PokéStops.
Figure 7. Histogram of nearest neighbor distances in m (log scale) along with the means (red vertical lines) and medians (blue vertical lines).