1,952
Views
9
CrossRef citations to date
0
Altmetric
Articles

Contributors’ enrollment in collaborative online communities: the case of OpenStreetMap

ORCID Icon, &
Pages 282-295 | Received 05 Jun 2017, Accepted 01 Aug 2017, Published online: 11 Sep 2017

Figures & data

Table 1. Classification of events related to the OSM project Wiki.

Figure 1. Distribution of new OSM members and new contributors over time.

Figure 1. Distribution of new OSM members and new contributors over time.

Table 2. Rupture points in spamming processes and potentially related events. “Date” refers to the rupture points, “Prior” and “After” show the proportion of accounts potentially derived from bot processes for each rupture points, “Days” is the number of days between the rupture point and the most relevant event found in the list within the surrounding days.

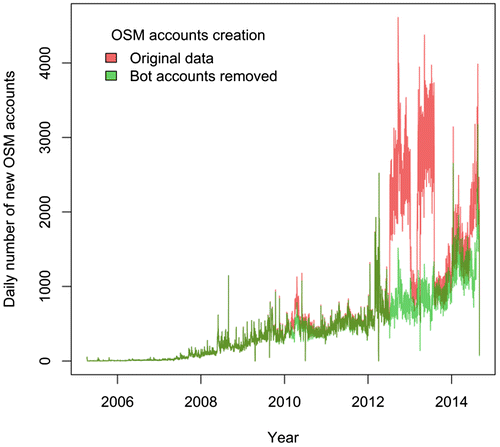
Figure 2. New OSM accounts prior (red) and after (green) bot account removal.

Figure 2. New OSM accounts prior (red) and after (green) bot account removal.

Figure 3. Compared time series analysis plots of (a) rates of new registered OSM members and (b) rates of new contributors, showing the observed values, the trend, the seasonal, and the random components. Source: Observed and trend values are the actual number of people, seasonal and random values are a proportion of the trend value.
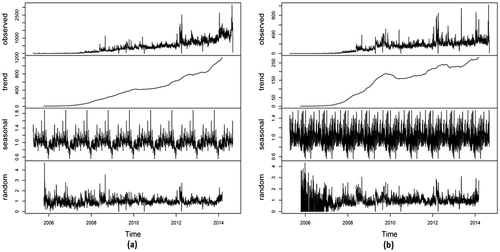
Figure 3. Compared time series analysis plots of (a) rates of new registered OSM members and (b) rates of new contributors, showing the observed values, the trend, the seasonal, and the random components. Source: Observed and trend values are the actual number of people, seasonal and random values are a proportion of the trend value.
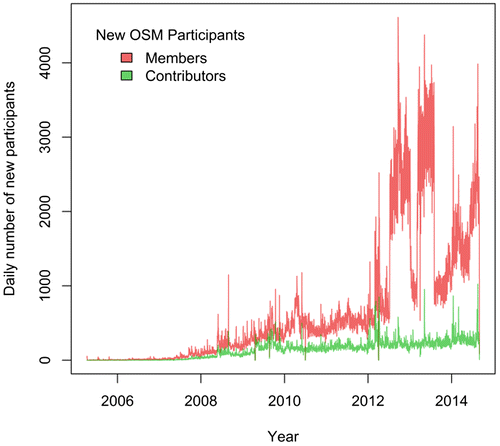
Table 3. Outstanding random variations of new OSM members with associated explanatory events.

Table 4. Outstanding random variations of new OSM contributors with associated explanatory events.

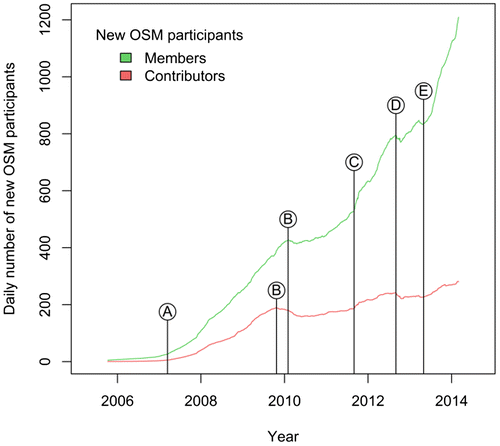
Figure 4. Trends in new OSM members and contributors with selected turning points events (A−E).

Figure 4. Trends in new OSM members and contributors with selected turning points events (A−E).

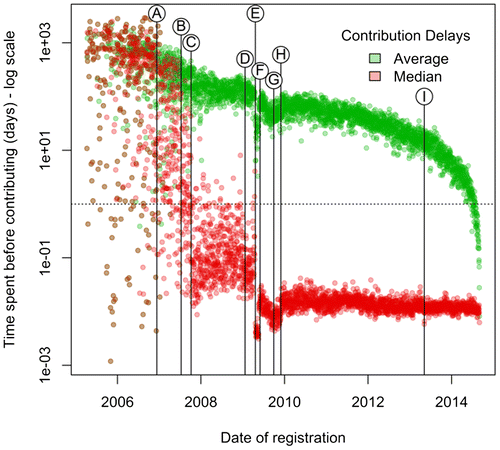
Figure 5. Delay between a user registration and contributions and key turning point events.

Figure 5. Delay between a user registration and contributions and key turning point events.

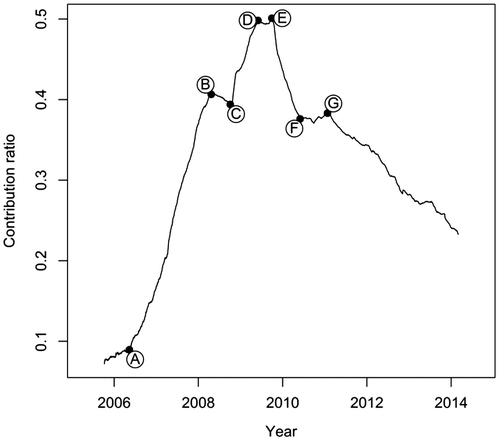
Figure 6. Evolution of contribution ratios over time and key turning point events.

Figure 6. Evolution of contribution ratios over time and key turning point events.