4,618
Views
12
CrossRef citations to date
0
Altmetric
Articles

Detecting vehicle traffic patterns in urban environments using taxi trajectory intersection points

ORCID Icon, &
Pages 333-344 | Received 30 Oct 2016, Accepted 09 Sep 2017, Published online: 22 Nov 2017

Figures & data

Figure 1. Imagined examples of trajectory polyline intersections with the example of (a) a detected road intersection with traffic lights, and of (b) elevated intersections, in comparison with (c) a trajectory polyline intersection patterns from real taxi trajectory data.
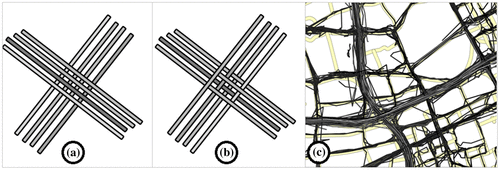
Figure 1. Imagined examples of trajectory polyline intersections with the example of (a) a detected road intersection with traffic lights, and of (b) elevated intersections, in comparison with (c) a trajectory polyline intersection patterns from real taxi trajectory data.

Table 1. Data structure of the inspected taxi FCD set of Shanghai.

Figure 2. Workflow for creating taxi TIPs.

Figure 2. Workflow for creating taxi TIPs.

Figure 3. Different visual patterns of taxi trajectory polylines at selected infrastructure elements, such as (a) crossroads, (b) crossing with changes in elevation, (c) on-ramps, (d) elevated highway, (e) elevated highway, and, (f) Nanpu bridge on-ramp.
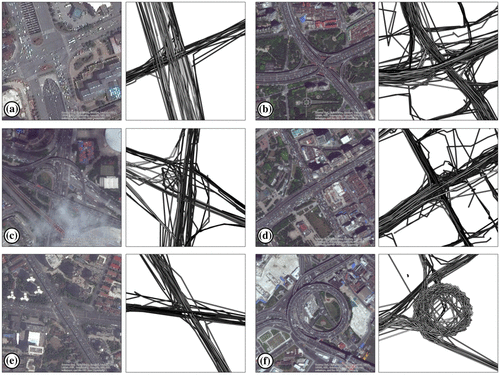
Figure 3. Different visual patterns of taxi trajectory polylines at selected infrastructure elements, such as (a) crossroads, (b) crossing with changes in elevation, (c) on-ramps, (d) elevated highway, (e) elevated highway, and, (f) Nanpu bridge on-ramp.

Figure 4. Attribute computation for trajectory polylines with (a) travel time based on average velocity differences, (b) travel time based on distances, and (c) travel time as averaged time stamps.

Figure 4. Attribute computation for trajectory polylines with (a) travel time based on average velocity differences, (b) travel time based on distances, and (c) travel time as averaged time stamps.

Figure 5. Visualization of (a) used taxi trajectory polylines, (b) resulting TIP extracts, (c) trajectory polylines with self-intersections, and (d) resulting self-intersection point extracts.
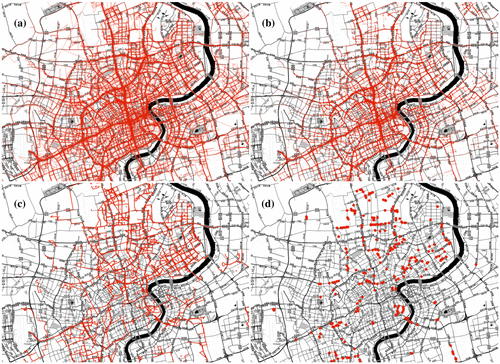
Figure 5. Visualization of (a) used taxi trajectory polylines, (b) resulting TIP extracts, (c) trajectory polylines with self-intersections, and (d) resulting self-intersection point extracts.

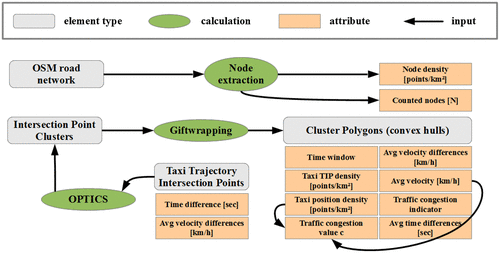
Figure 6. Workflow for creating and enriching taxi TIP polygons.

Figure 6. Workflow for creating and enriching taxi TIP polygons.

Figure 7. Comparison between the three quantities taxi density, avg. speed, and traffic congestion value c, respectively, for two selected time windows.
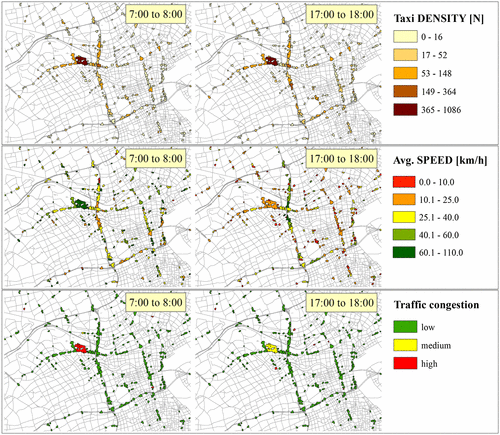
Figure 7. Comparison between the three quantities taxi density, avg. speed, and traffic congestion value c, respectively, for two selected time windows.

Figure 8. Level of complexity of transportation infrastructure elements for the center area of Shanghai, with (a) counted road network nodes and (b) calculated node density.
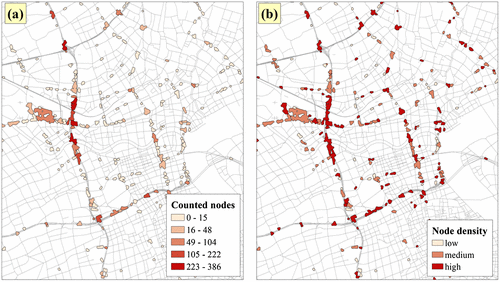
Figure 8. Level of complexity of transportation infrastructure elements for the center area of Shanghai, with (a) counted road network nodes and (b) calculated node density.

Figure 9. Selection of TIP polygon in the north of Shanghai based on taxi FCD from 8:00 to 9:00 am on 22 February 2007.
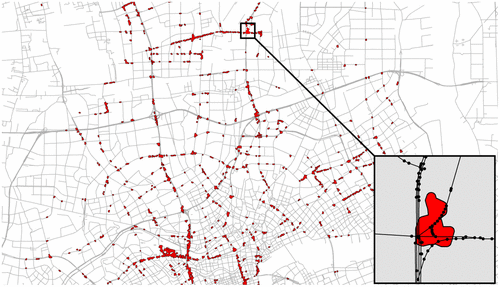
Figure 9. Selection of TIP polygon in the north of Shanghai based on taxi FCD from 8:00 to 9:00 am on 22 February 2007.

Table 2. Distribution of the average traffic information in one selected area in Shanghai from 8:00 am to 8:00 pm (Thursday, 22 February 2007).