3,047
Views
1
CrossRef citations to date
0
Altmetric
Articles

UAV navigation system using line-based sensor pose estimation

ORCID Icon &
Pages 2-11 | Received 12 Jan 2017, Accepted 06 Nov 2017, Published online: 12 Jan 2018

Figures & data

Figure 1. Hardware components of the indoor/outdoor mapping and tracking UAV.

Figure 1. Hardware components of the indoor/outdoor mapping and tracking UAV.

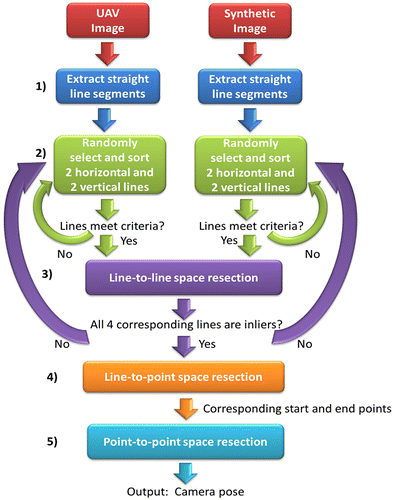
Figure 2. The proposed pose estimation workflow.

Figure 2. The proposed pose estimation workflow.

Figure 3. Line matching example: Real image (A) and corresponding synthetic image (B), each with 2 randomly sampled horizontal lines, sorted top to bottom (labeled as 1 and 2) and 2 randomly sampled vertical lines, sorted left to right (labeled 3 and 4). The real image lines’ corresponding virtual image line start and end points estimated by the point-to-line space resection (C).

Figure 3. Line matching example: Real image (A) and corresponding synthetic image (B), each with 2 randomly sampled horizontal lines, sorted top to bottom (labeled as 1 and 2) and 2 randomly sampled vertical lines, sorted left to right (labeled 3 and 4). The real image lines’ corresponding virtual image line start and end points estimated by the point-to-line space resection (C).
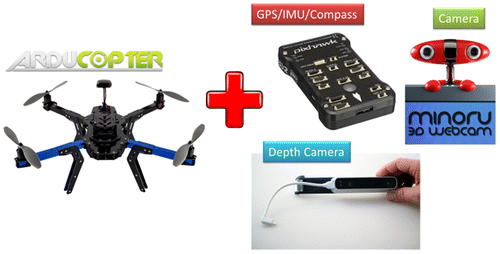
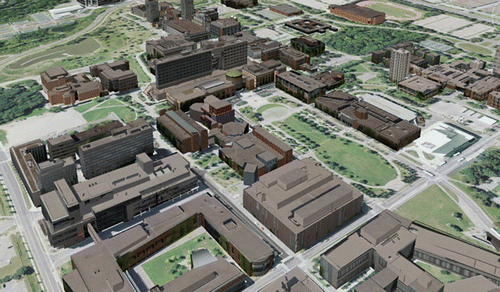
Figure 4. York University 3D campus model.

Figure 4. York University 3D campus model.

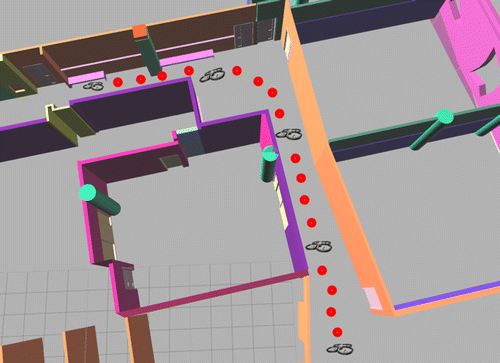
Figure 5. UAV trajectory in the indoor environment.

Figure 5. UAV trajectory in the indoor environment.

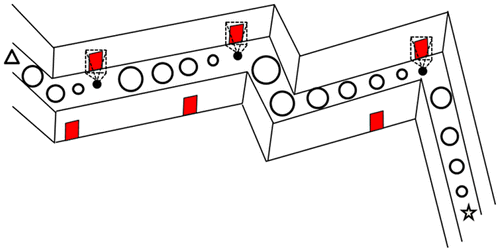
Figure 6. Combining map-based and map-building localization techniques.

Figure 6. Combining map-based and map-building localization techniques.

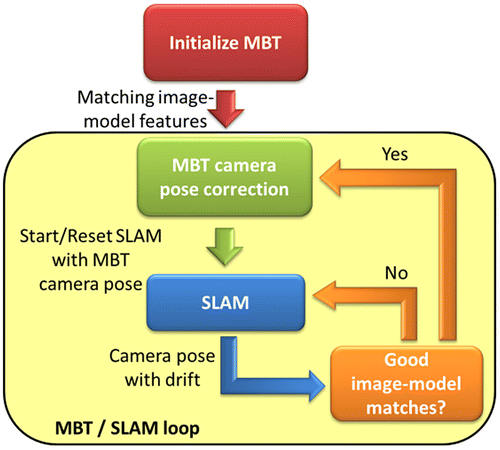
Figure 7. MBT / SLAM integration workflow.

Figure 7. MBT / SLAM integration workflow.

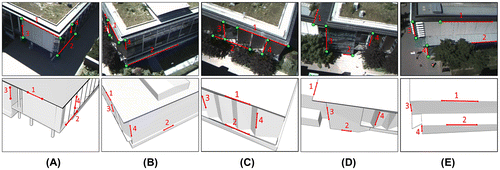
Figure 8. Outdoor experiment: Tracking a 3D building model using the camera of a UAV.

Figure 8. Outdoor experiment: Tracking a 3D building model using the camera of a UAV.

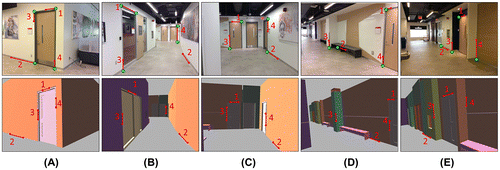
Figure 9. Indoor experiment: Tracking a 3D indoor model using the camera of a UAV.

Figure 9. Indoor experiment: Tracking a 3D indoor model using the camera of a UAV.

Table 1. Outdoor experiment: average () and standard deviation (σσ) of the pose standard deviations from the least squares adjustment for the 5 frames in Figure 8.

Table 2. Indoor experiment: average () and standard deviation (σσ) of the pose standard deviations from the least squares adjustment for the 5 frames in Figure 9.

Table 3. Outdoor experiment’s check point statistics: the averages and standard deviations of the differences between ground truth model coordinates and object coordinate calculated by the point-to-line resection for horizontal (H) lines and vertical (V) lines.

Table 4. Indoor experiment’s check point statistics: The averages and standard deviations of the differences between ground truth model coordinates and object coordinate calculated by the point-to-line resection for horizontal (H) lines and vertical (V) lines.