Figures & data
Figure 1. Study area within inner London.
Table 1. Remaining numbers of Flickr images and users after applying each task of the data filtering.
Figure 2. Number of users taking photographs in each grid cell.
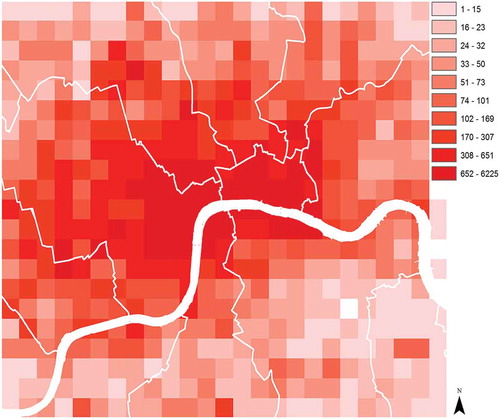
Table 2. Median corpus distance and number of cells per topic as a function of the number of topics for different grid resolutions.
Figure 3. Comparison between clusters of 40 topics with respect to the grid resolution. (a) 1 km vs. 500 m; (b) 500 m vs. 250 m; (c) 250 m vs. 50 m.
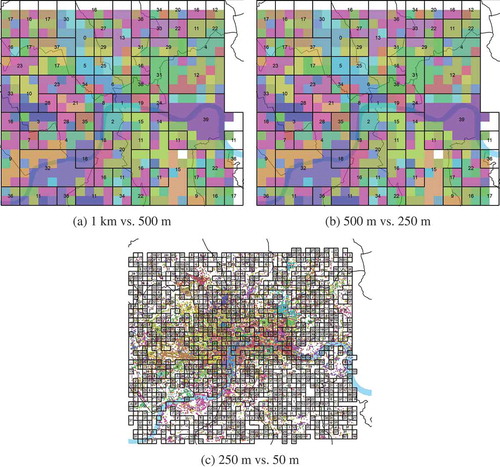
Figure 4. Change in median corpus distance for different number of topics with respect to grid resolution.
Figure 5. Corpus distance for topics associated with different numbers of cells at a resolution of 500m.
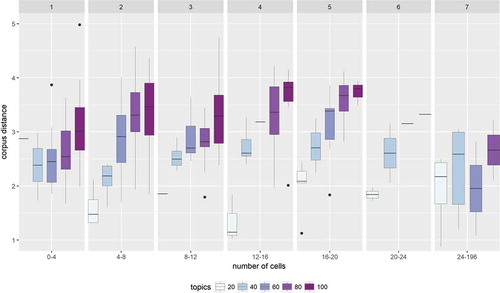
Figure 6. Number of topics associated with the 500m cells for each implementation of the model.
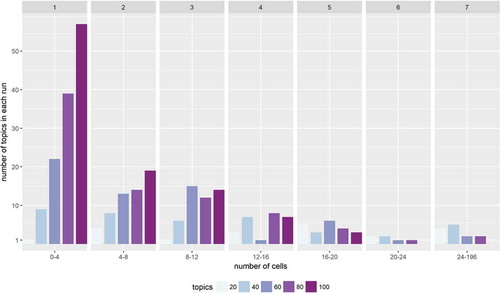
Figure 7. Topic coherence value for labeled and unlabeled topics.
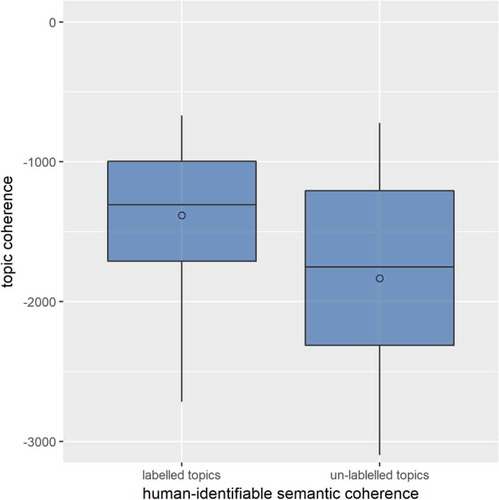
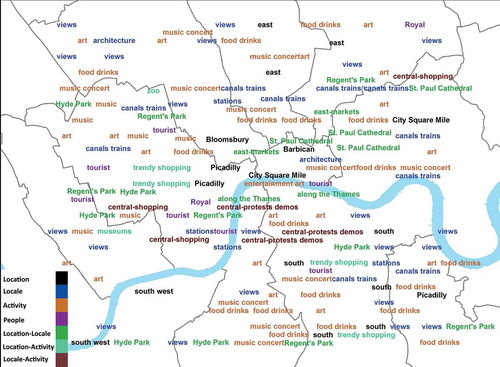
Figure 8. Labeled topics (numbered cells) and example topics, labels, and tags (size as a function of probability).
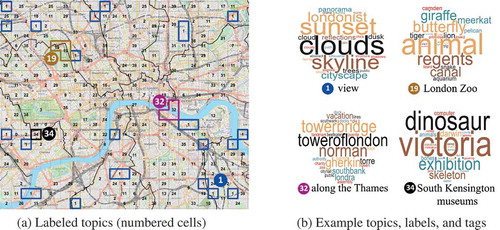
Figure 9. Map of London describing users’ perception of the space as places.