Figures & data
Figure 1. Affected and control areas of the analyzed earthquakes in Nepal/India (a) and Italy (b).
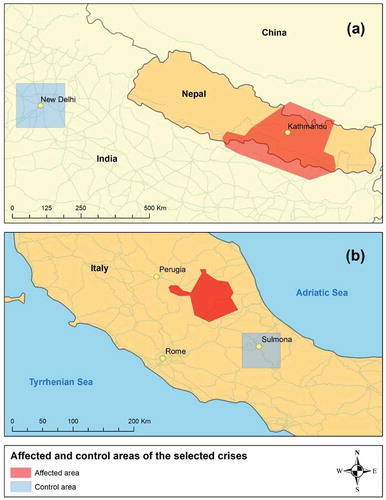
Figure 2. Edit and user counts for OSM ways in the affected Nepal area (a) and number of local and external contributors including HOT members (b) (# = number).
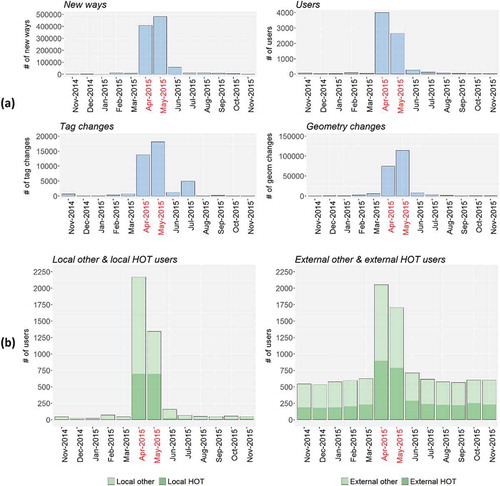
Table 1. Monthly activities of local and external contributors who also mapped during the Nepal earthquake.
Figure 3. Monthly numbers of first OSM change-sets submitted by local (a) and external (b) contributors who mapped in the affected Nepal area during the earthquake.
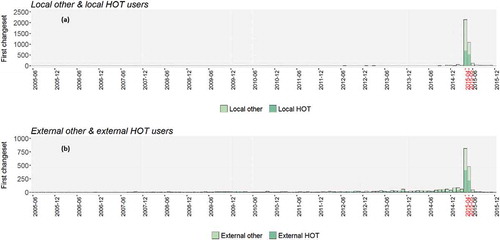
Figure 4. Most prominent OSM node (a) and way (b) features mapped in the affected Nepal area.
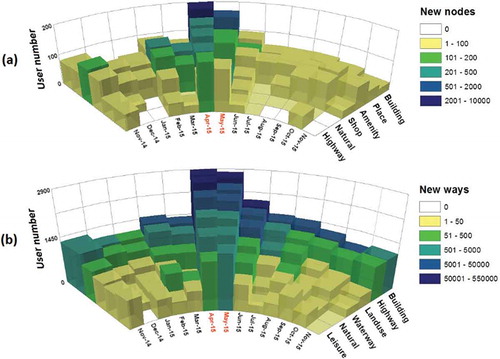
Figure 5. Edit and user counts for OSM ways in the affected Italy area (a) and number of local and external contributors including HOT members (b) (# = number).
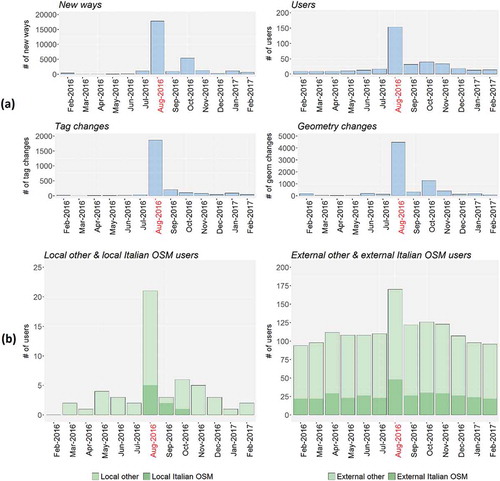
Figure 6. Monthly numbers of first OSM change-sets submitted by local (a) and external (b) contributors who mapped in the affected Italy area during the earthquake.
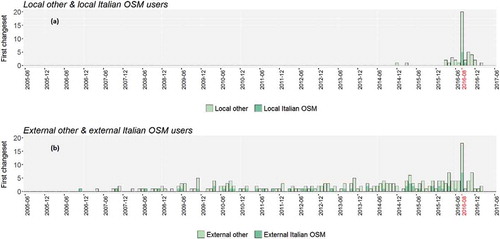
Figure 7. Most prominent OSM node (a) and way (b) features mapped in the affected Italy area.
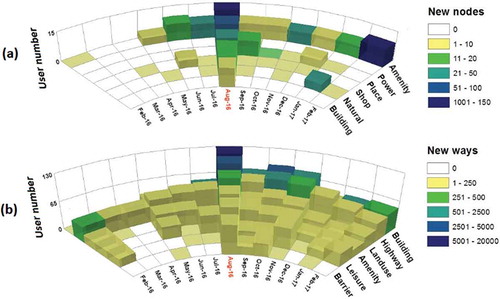
Figure 8. Average monthly number of tweets in the affected Nepal area and the New Delhi reference area (a) and daily number of tweets in both areas (b) (# = number).
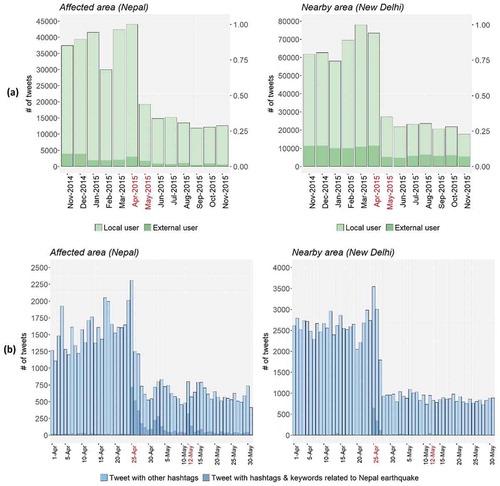
Figure 9. Average monthly number of tweets in the affected Italy area and the Sulmona reference area (a) and daily number of tweets in both areas (b) (# = number).
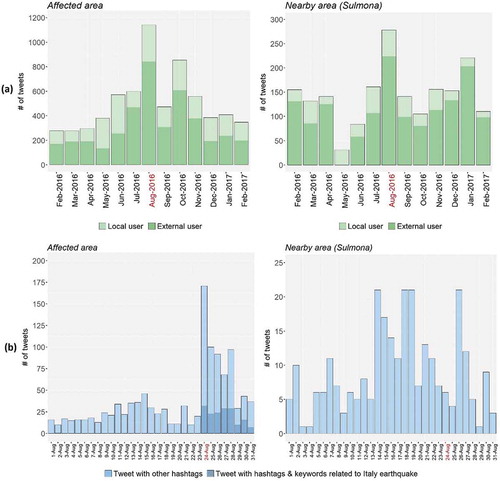
Figure 10. Distribution of reported OSM sources by local (a) and external (b) contributors in the affected Nepal area (# = number).
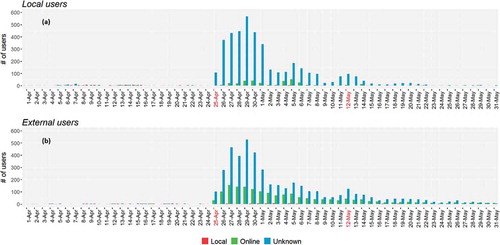
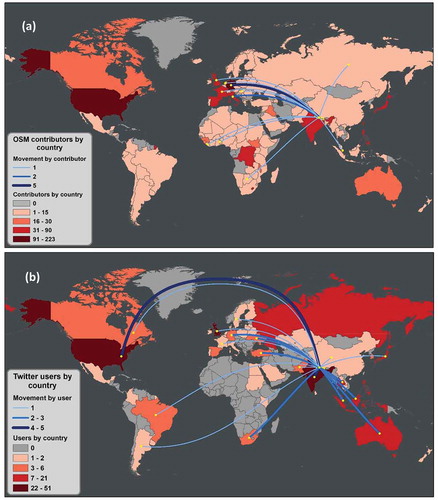
Figure 11. Nepal earthquake: OSM contributors (a) and Twitter users (b) by country, overlaid by user flow lines derived from both sources.