Figures & data
Figure 1. The popularities of Foursquare secondary categories in the pre-processed dataset.
Figure 2. Terms (in gray) and synthetic documents (colored to main categories) in the four main semantic dimensions. (a) and (b) plot the second dimension against the first dimension, where (b) enlarges the highlighted part of (a). (c) and (d) plot the third and fourth dimensions against the 1st dimension respectively.
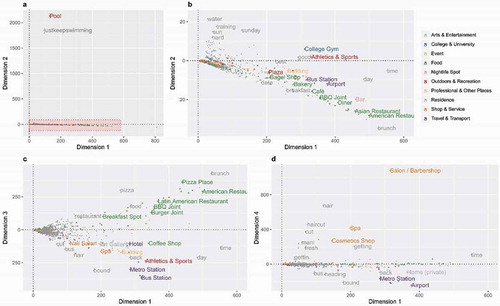
Table 1. General types of terms with respect to their interrelations across semantic concepts.
Figure 3. An example of four terms with their most associated semantic concepts (in log scales).
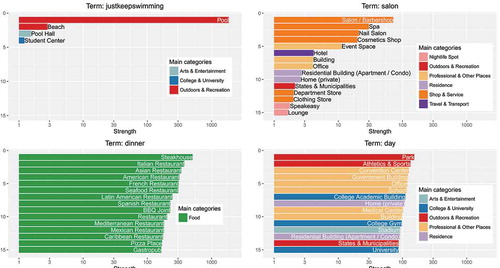
Figure 4. The representativeness of all terms (a). The most representative terms are re-plotted in (b), and their most related semantic concepts are labeled in (c).
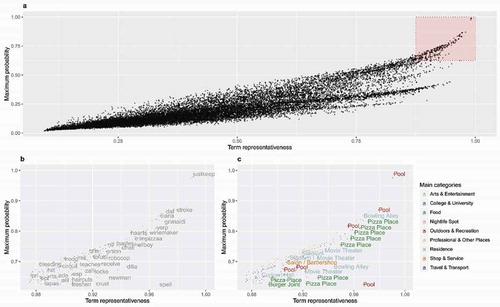
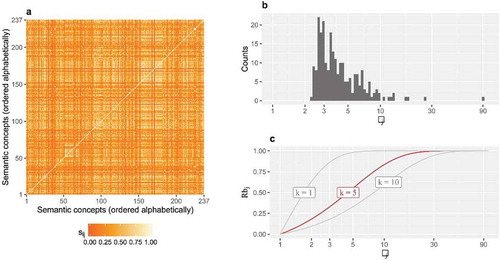
Figure 5. The quantified representability of semantic concepts (a). The most and least representable examples are plotted with labels in (b) and (c) respectively.
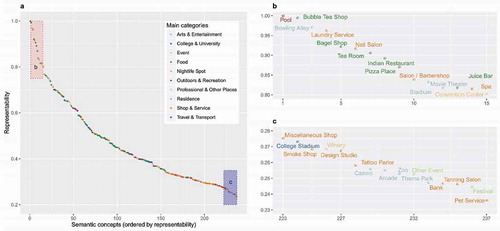
Figure 6. Verification of the quantified representability of semantic concepts by the predicting precision.
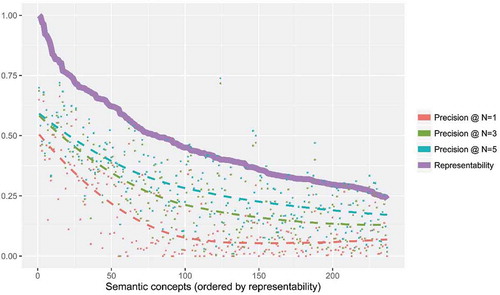
Figure A1. The rule specified by Equation (1) to decide sample sizes for each synthetic document (a) and the results after the application of the rule (b). Both subfigures are plotted in log scales.
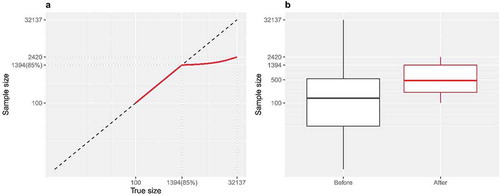
Figure A2. Graphic demonstration of the transformation from entropy (Ei) to representativeness (Rti).
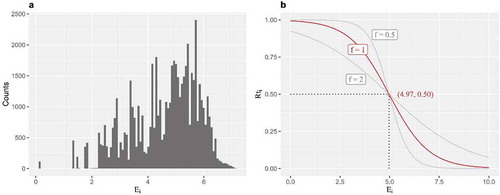
Figure A3. Graphic demonstration of the transformation from dissimilarity (λj) to representability (Rbj).