Figures & data
Figure 1. A comparison of an Euclidean distance matrix versus a drive time distance matrix and a road distance matrix around the center point of Coventry. (a) Euclidean distance buffer from 0 to 4 miles around the centre of Coventry; (b) Travel time distance buffer from 0 to 10 minutes drive time around the centre of Coventry; (c) Road distance buffer from 0 to 4 miles around the centre of Coventry.
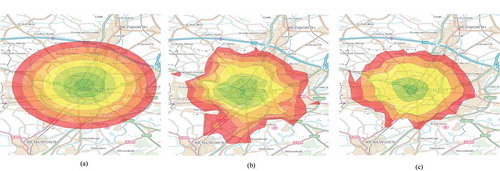
Table 1. All restrictions to road network and travel time OSRM calculation from OSM labels.
Table 2. Feature name, description and data type in HMLR’s Price Paid dataset.
Table
Figure 2. A situation where P3 and P4 are not satisfied.
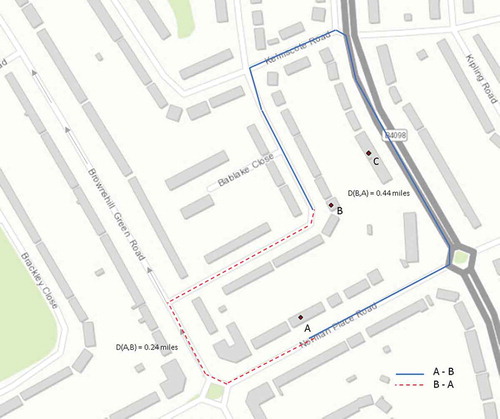
Figure 3. The goodness of fit value for each Minkowski coefficient tested against the OSRM’s actual road distance calculations, travel time calculations and a linear model of both (here embedded R2 = r2, and P-Value = p-value). (a) OSRM road distance versus Minkowski p-value goodness of fit graph; (b) OSRM travel time versus Minkowski p-value goodness of fit graph; (c) OSRM linear combination of road distance and travel time versus Minkowski p-value goodness of fit graph.
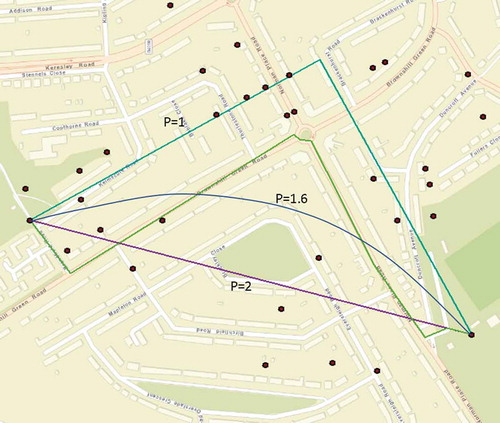
Figure 4. A streetmap comparing the distances: the road distance, the Euclidean distance, the Manhattan distance and the Minkowski estimated distance.
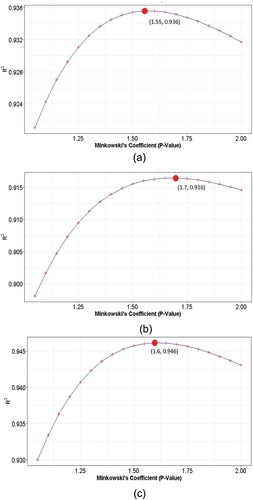
Figure 5. Spatially aware checkerboard sampling utilized in the validation process to confirm the model is not over fitted.
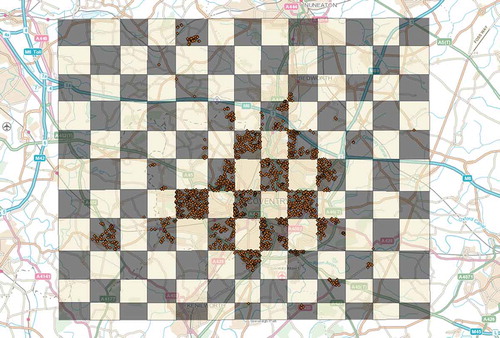
Table 3. Results for 10-fold cross-validation.
Table 4. Results for checkerboard holdout.
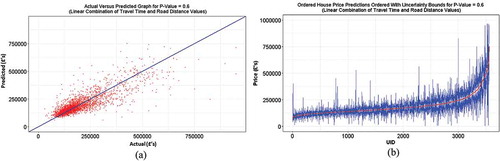
Figure 6. Validation diagrams: (a) the actual versus predicted graph and (b) house price prediction graph with uncertainty bounds both with a Minkowski coefficient of p = 1.6.