Figures & data
Figure 1. Progression of step phases.
Figure 2. Detection of stand intervals using the signal energies of acceleration and angular rate with a foot mounted sensor.
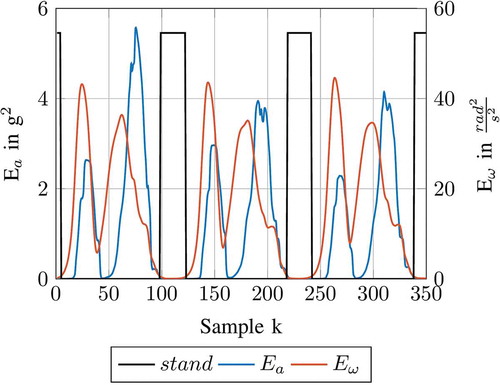
Figure 3. Velocity correction of three steps by ZUPT.
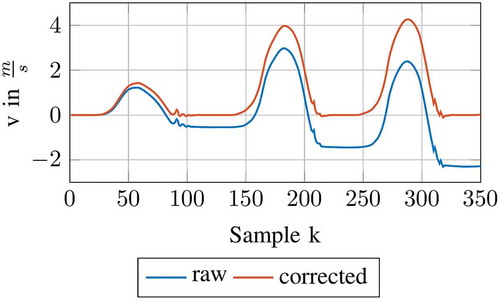
Figure 4. Calculation of Orientation Angle Correction.
Figure 5. Orientation Angle Correction.
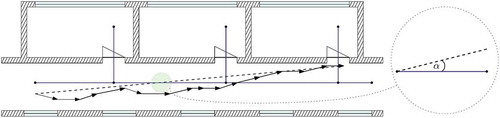
Figure 6. Correction using Path Information with as the orientation and
as the distance of a step relative to a nearby path.
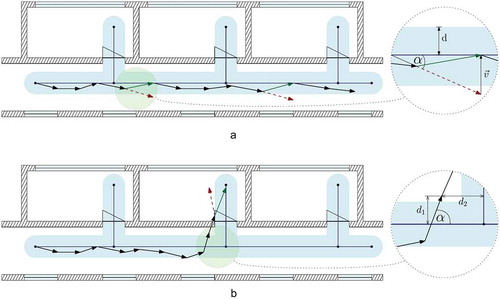
Figure 7. Correction using Path Information.
Figure 8. Correction using Wall Information: Reflection by walls.
Figure 9. Correction using Wall Information with intersection angle . Acute angles lead to a search for gaps while shallow angles result in reflection.
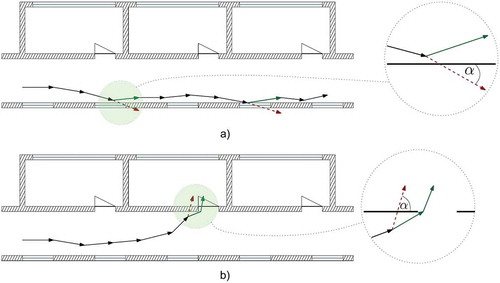
Figure 10. Finding the entrance door with a precise GPS position as a temporary starting point.
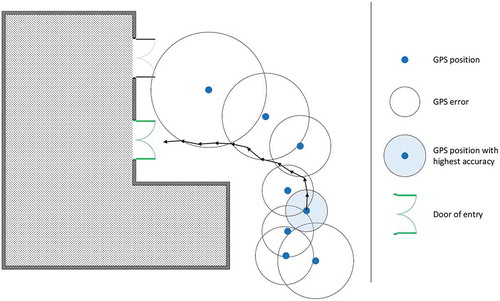
Figure 11. Routes used in the experiment.
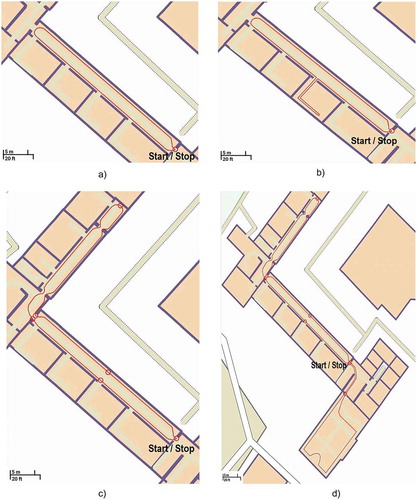
Figure 12. Entrance 1 at the northern side of the test building.
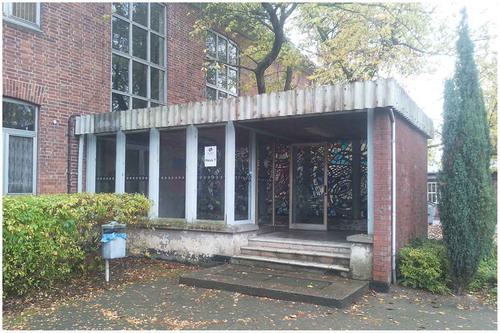
Figure 13. Entrance 2 at the southern side of the test building.
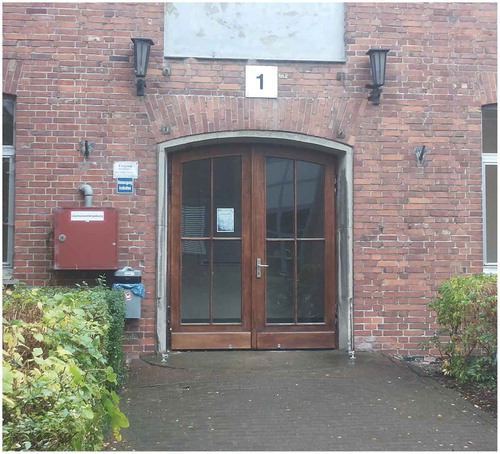
Figure 14. The position of the reference line for the initial orientation.
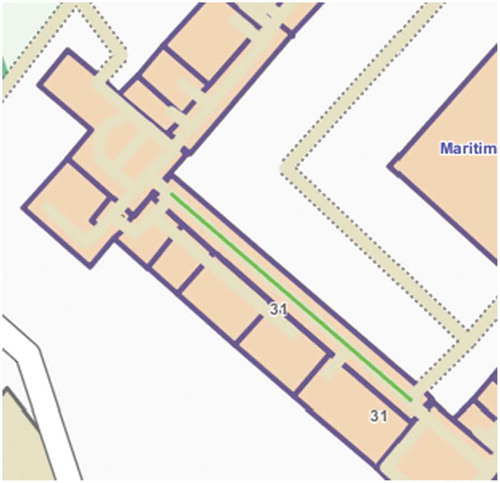
Table 1. Accuracy results, measured as the distance between the start and end point, relative to route length. Accuracy improvements are highlighted.
Figure 15. Path estimation accuracy: Path deviation at end of each route.
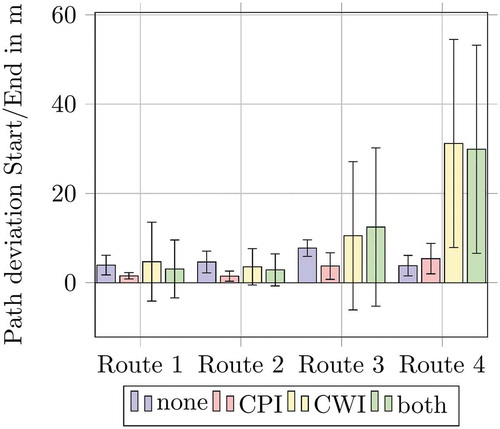
Figure 16. Erroneous dead ends by CWI halfway through routes 3 and 4. The computed user trajectory is visible as a blue line. The true paths lead back through the respective corridor.
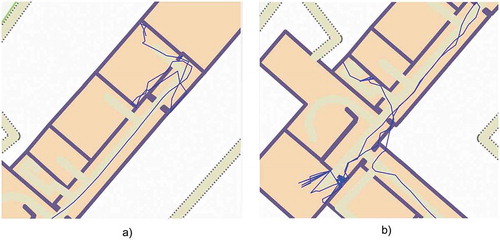
Figure 17. Computation time of PDR calculation per detected step.
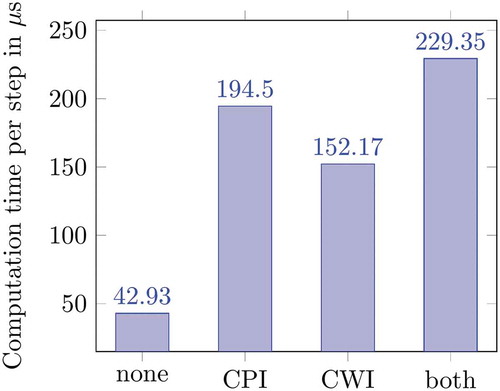
Figure 18. Histogram of the initial orientation error from GPS and PDR.
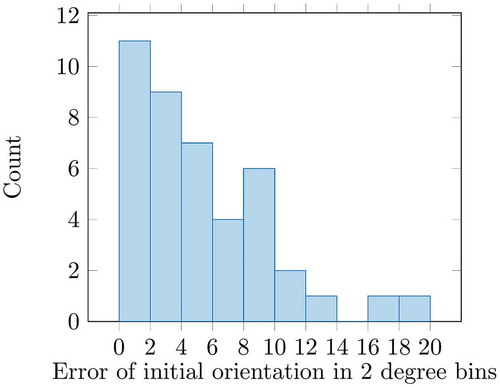
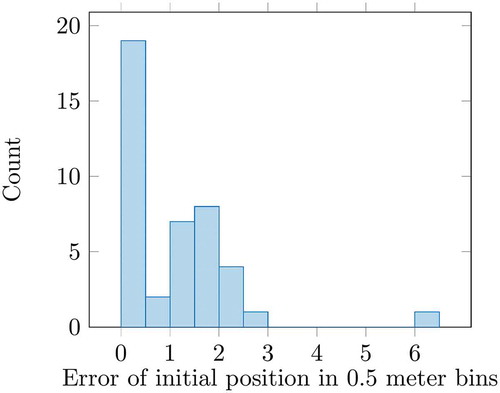
Figure 19. Histogram of the initial position error from GPS and PDR.