Figures & data
Table 1. List of definitions for data gathered from citizens (adapted from Assumpção et al. Citation2018).
Figure 1. The Tiber River basin case study: river basin boundary and network with identification of the main boundary conditions of the domain of interest. The right insets include images from recent flood events in the Orte-Castel Giubileo floodplain.
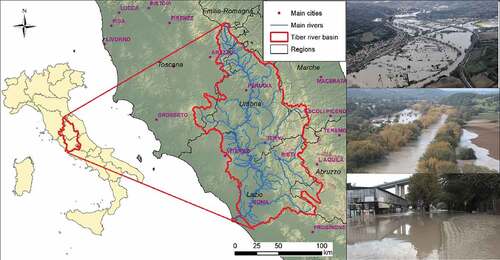
Table 2. Topographic data sources and layers.
Table 3. Selected VGI images.
Figure 2. Location of the crowdsourced images selected for the November 2012 Tiber River flood event.
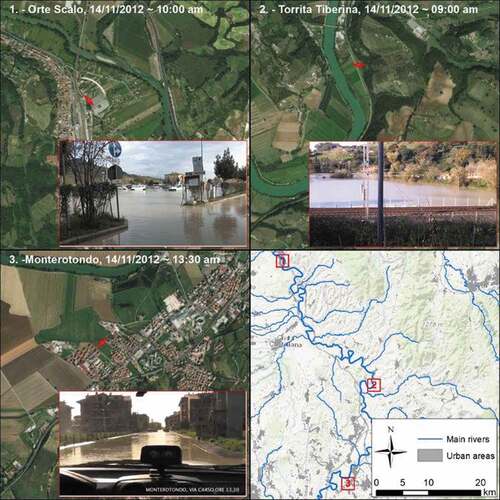
Figure 3. Example of perturbation error due to location for VGI observation.
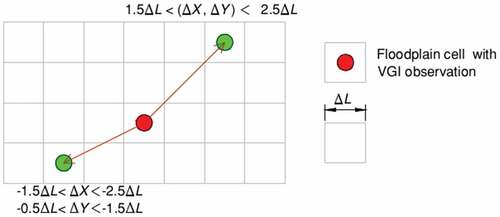
Figure 4. Scheme of the perturbation of the ensemble considering the timing error. The continuous lines are the forecasting variables; the dashed lines are the auxiliary simulations to set each time step the value of the observation for every ensemble.
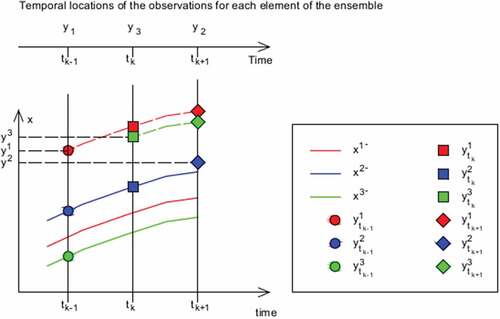
Table 4. Comparison of the means of the observed, simulated and updated water levels at the location of the VGI observations.
Figure 5. (a) Location of the VGI image in Torrita Tiberina. (b) Map of the water level correction at the time of the Torrita Tiberina VGI acquisition (09:00 14/11/2012). (c) Hydrograph of the mean water depths at the Torrita Tiberina channel cell. (d) Mean water surface elevation profile considering the updated and no updated simulations.
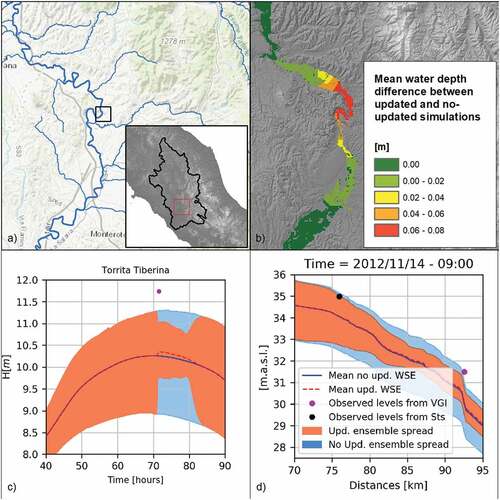
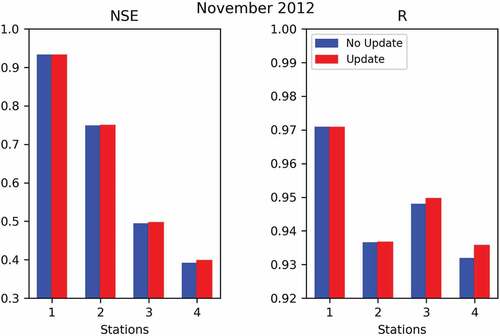
Figure 6. Performance indexes NSE (Nash–Sutcliffe Efficiency) and R (Pearson Correlation) at 4 stage gage stations (1: Ponte Felice; 2: Stimigliano; 3: Nazzano; 4: Ponte del Grillo).