
Figures & data
Table 1. Error Distribution Data.
Figure 1. The cumulative error distribution of relative height estimates by Huawei Mate8 and Samsung Note2.
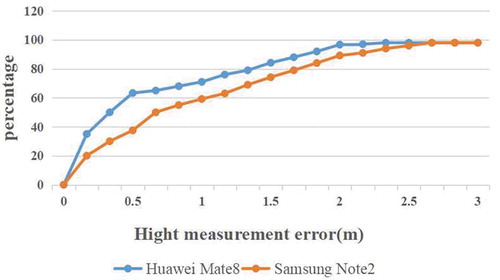
Figure 2. Pressure changes over time in four states.
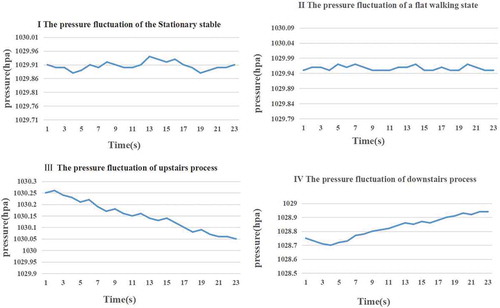
Table 2. Average pressure differences of four states at the intervals of 2 s (Air pressure units: hpa).
Figure 3. Flow chart of going-upstairs and going-downstairs behavior detection.
Figure 4. Monitoring area schematic diagram.
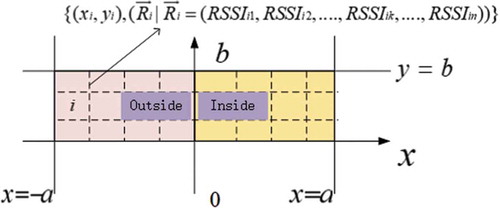
Figure 5. Monitoring area flow-process diagram.
Figure 6. Different movement route schematic diagram.
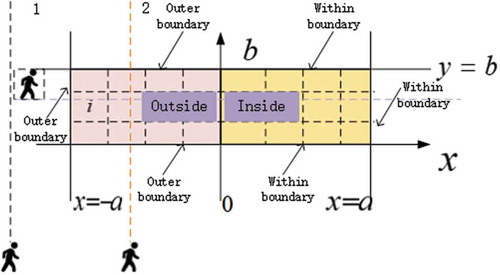
Figure 7. The flow chart of “entering” detection algorithm.
Figure 8. Barometric difference between Huawei Mate8 (right) and Samsung (left).
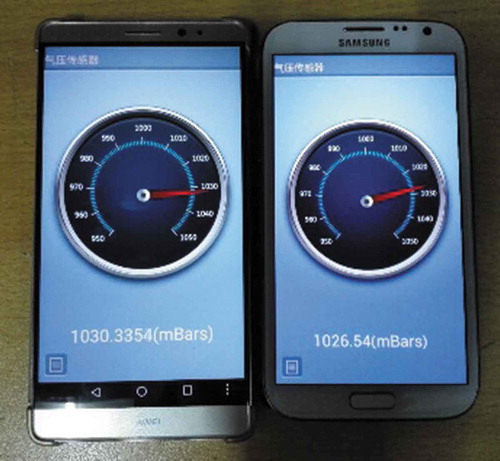
Figure 9. Experimental buildings.
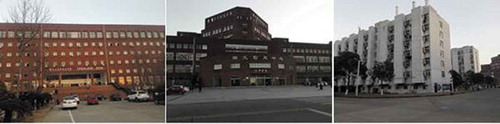
Figure 10. Precision of going upstairs and going-downstairs detection.
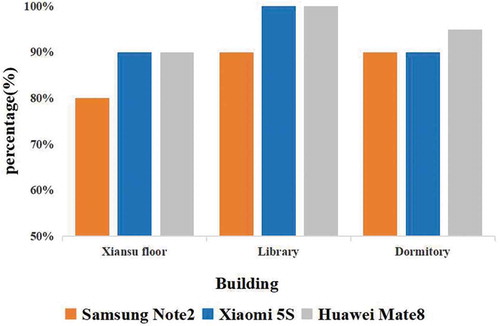
Figure 11. Precision of “entering” detection.
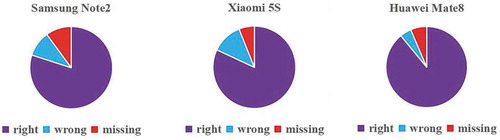
Table 3. Correct number of the floor identification.
Table 4. Accuracy comparison of four floor positioning methods.