Figures & data
Figure 1. The study area of Benue State.
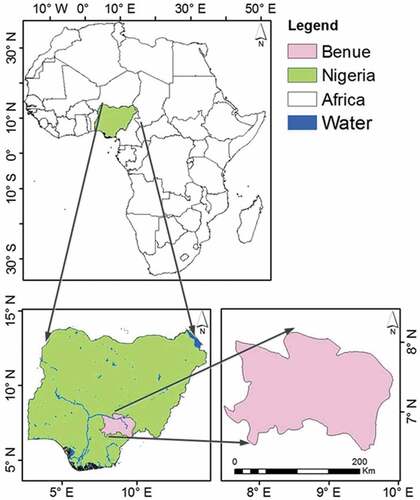
Table 1. Data sets and their suitability classification.
Figure 2. Maps of (a) mean temperature (oC) of 1985– 2015, (b) mean precipitation (mm) of 1985-2015, (c) soil pH, (d) bulk density (g/cm3), (e) CEC (cmol/kg), (f) land cover, (g) slope (% rise), (h) SOC (g/kg).
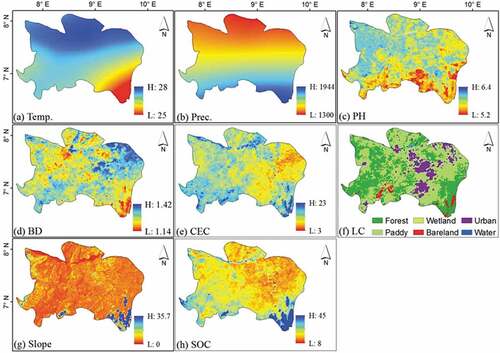
Figure 3. Rasterized suitability criteria for rice cultivation over Benue State, constraint (a) mean temperature, (b) mean precipitation, (c) soil pH, (d) bulk density, (e) CEC, (f) land cover, (g) slope, (h) SOC.
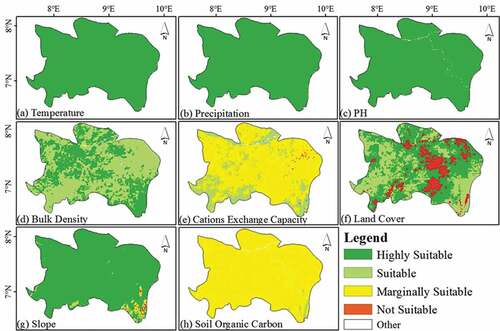
Table 2. Scales for pair-wise AHP comparisons (Maddahi et al. Citation2014).
Table 3. PCM of all the parameters relevant to rice crop land suitability for Benue State, Nigeria.
Table 4. Random index.
Figure 4. Comparison between CRU gridded and NIMET Observation data for (a) Precipitation and (b) Temperature, (c) Seasonal relationship between CRU and Observation.
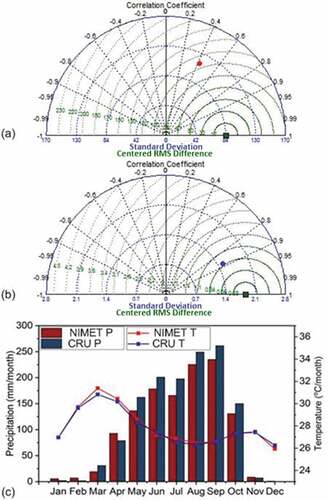
Table 5. Summary of spatial regression results (change in pixels over study area).
Figure 5. Seasonal NDVI from 1985 to 2015.
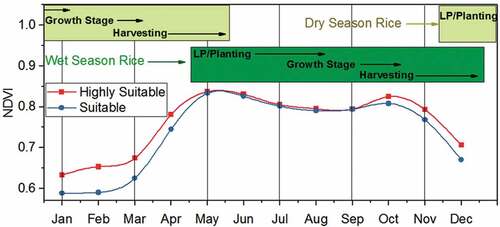
Figure 6. Spatial regression trend between (a) growing season NDVI and precipitation (mm/NDVI unit), (b) dry season NDVI and precipitation (mm/NDVI unit), (c) growing season NDVI and temperature (oC/NDVI unit), and (d) dry season NDVI and temperature (oC/NDVI unit) from 1985 to 2015.
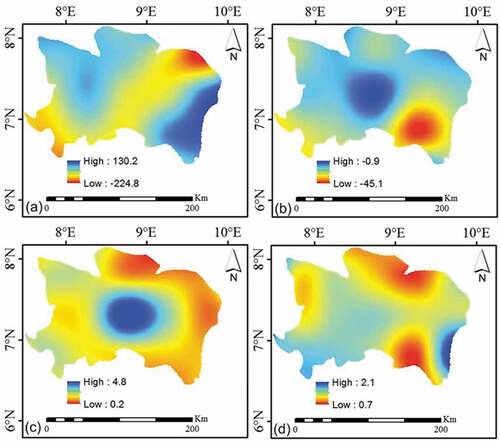
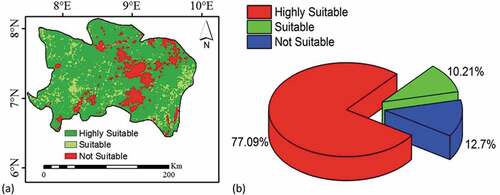
Figure 7. Land suitability analysis for paddy field cultivation based on multi-criterion method, (b) percentage composition of the suitability classes.