Figures & data
Figure 1. Location of the study area.
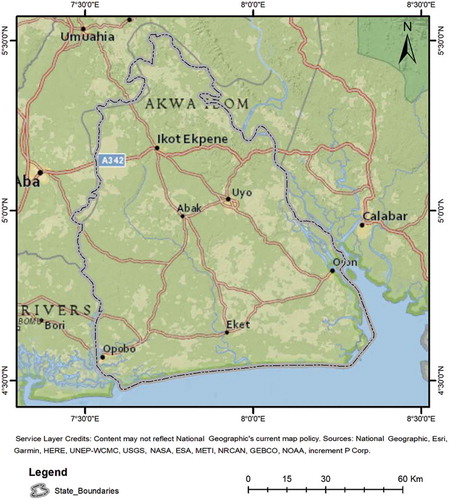
Table 1. Speed model scenarios and conditions.
Figure 2. Location and distribution of HCF across Akwa Ibom State.
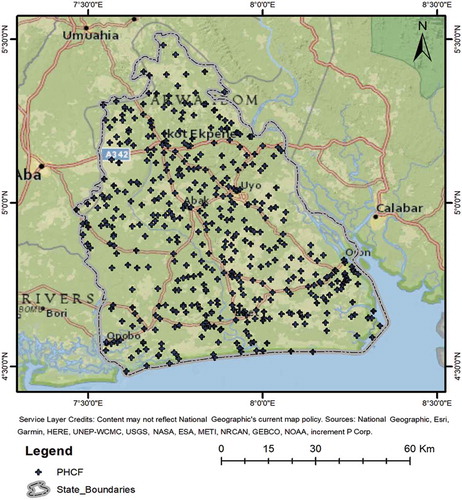
Figure 3. Distribution of population (at LGA level) per PHCF.
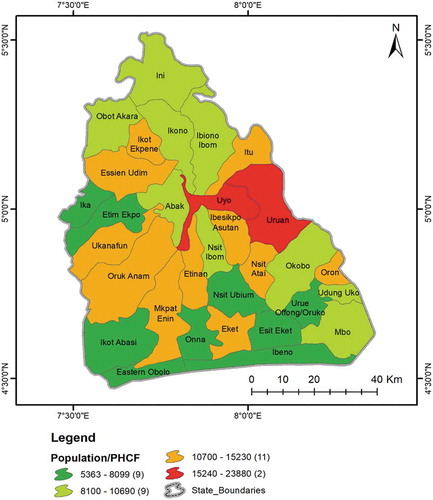
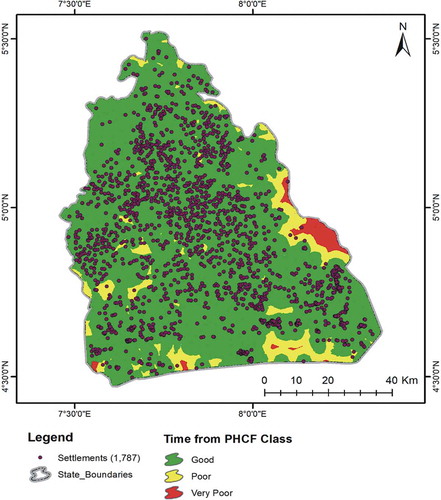
Figure 4. Drive time to nearest PHCF across the study area.
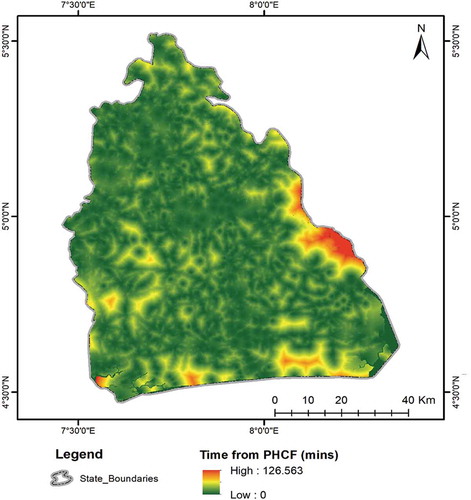
Figure 5. Mean and SD bars of travel time to PHCF per LGA.
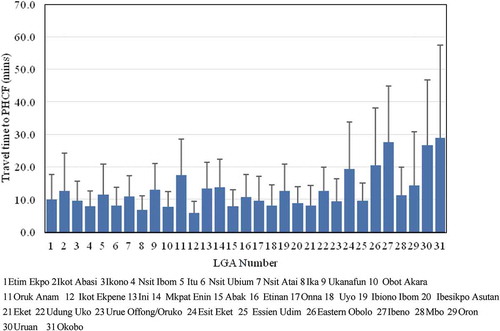
Table 2. Classes of the travel time to the PHCF.
Figure 6. Access class and settlement point across the study area.