Figures & data
Figure 1. Photos of the CE-3 and CE-4 rovers on the lunar surface taken by the landers.
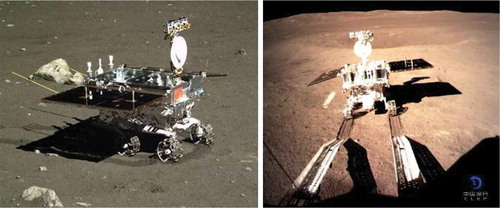
Figure 2. Technical framework of the geospatial technologies and applications in CE-3 and CE-4 missions.
Figure 3. DEM (Left) and DOM (Right) of CE-3 landing site.
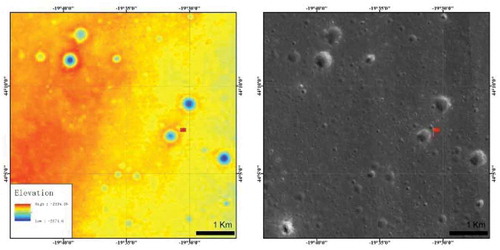
Figure 4. Imagery and topography of CE-4 landing site and surrounding area. Left: CE-2 DOM, Upper-right: 3D perspective of color-coded SLDEM2015, Lower-right: LROC WAC mosaic and pre-selected landing site (white box) of CE-4.
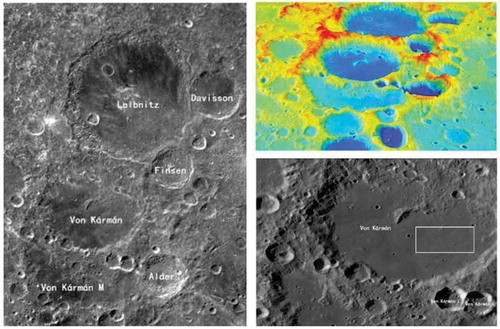
Figure 5. LROC NAC DOM mosaic of CE-4 landing site with a resolution of 0.9 m (Liu, Di, Li Citation2019).
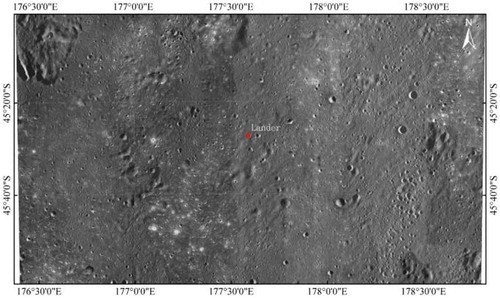
Figure 6. CE-3 landing site DEM and DOM (0.05-m resolution) generated from descent images (Liu, Di, and Peng Citation2015).
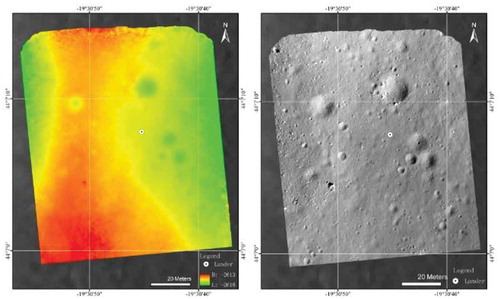
Figure 7. CE-4 landing site DOM (0.03-m resolution) generated from descent images (Di, Liu, and Liu Citation2019c).
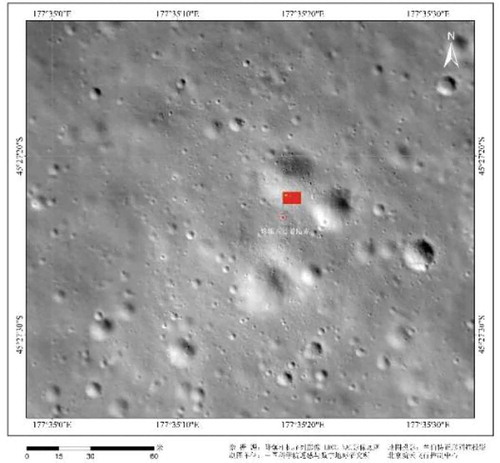
Figure 8. DEM (Upper-left), DOM (Upper-right), slope map (Lower-left), and obstacle map (Lower-right) derived from CE-3 Navcam images at the lander location (Liu, Di, and Peng Citation2015).
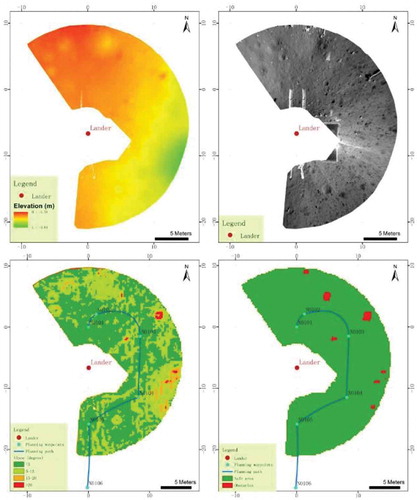
Figure 9. The 360° Pancam image mosaics generated from left-eye images taken by Yutu-2 rover at three locations.
Figure 10. DEM of CE-4 landing site derived from Pancam images taken at three locations (black dots).
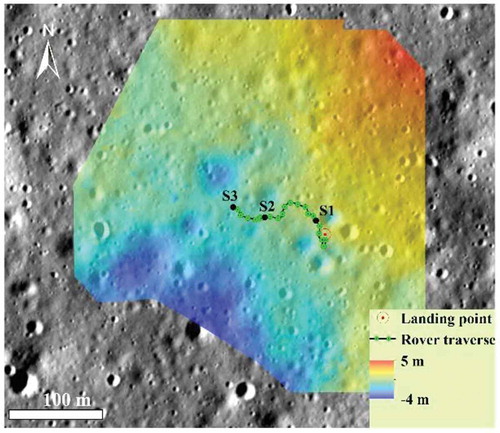
Figure 11. Yutu rover traverse map.
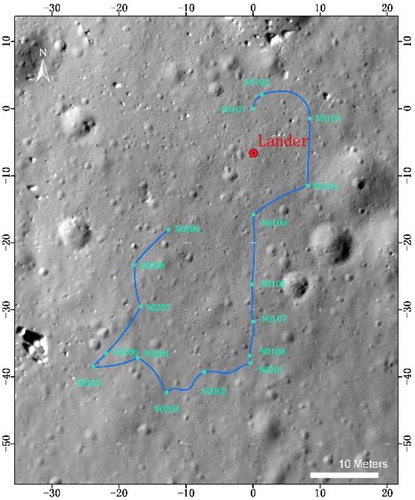
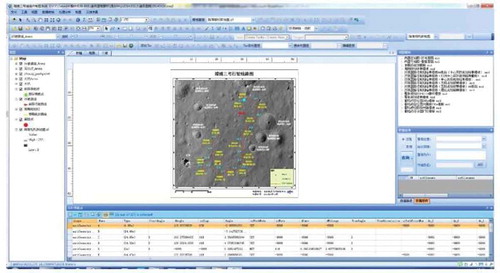
Figure 12. Main interface of the digital cartography system for supporting rover teleoperation.