Figures & data
Figure 1. The number of national and regional organizations, including space agencies and facilities currently involved in remote sensing and Geo-Information Sciences in Africa.
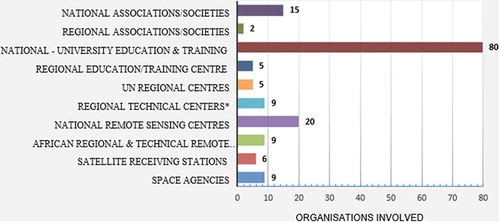
Table 1. Some of the prominent university departments offering degree courses in Africa. Included into the list are also space agencies partnering with universities in research programs.
Figure 2. Survey questionnaire results on academic institutions (Universities/colleges) offering courses in EO and Geo-Information Sciences. Three persons/country, identified from the 2016 private sector companies list of respondents, were used in this survey questionnaire.
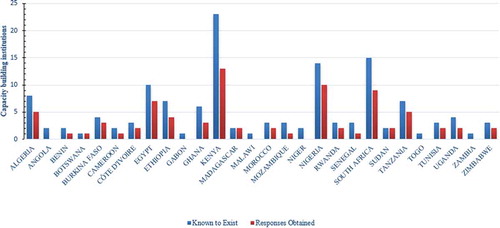
Table 2. The list of African satellites launched from 1998 to 2020. The satellites were launched for Earth Observation (Designated as A); science technology demonstration and education/scientific experiments (B); Communication (C); Reconnaissance/Military (radar) (D) and for climate change and weather monitoring (E).
Figure 3. Added number of African private companies registered by 2019. Most of them are late respondents to the call made in 2016.
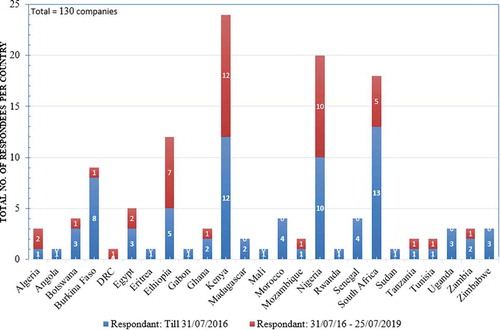
Figure 4. The total number of employees accounted for 2019 (red) versus 2016 (blue). The late respondents registered more than 45% increase in employees to the 2016 calls.
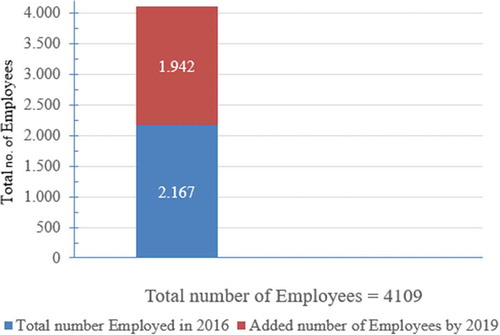
Figure 5. Company revenues increased in 2019.
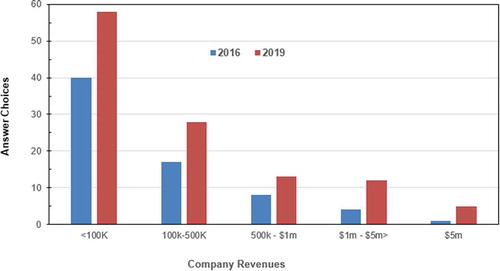
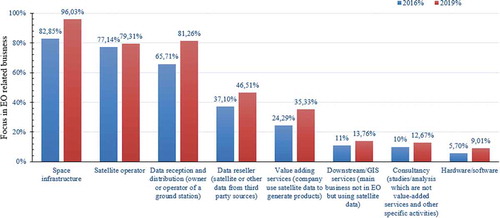
Figure 6. This figure shows the most important market segments in which companies do business.