Figures & data
Figure 1. A sample Milwaukee GSV panoramic image series.
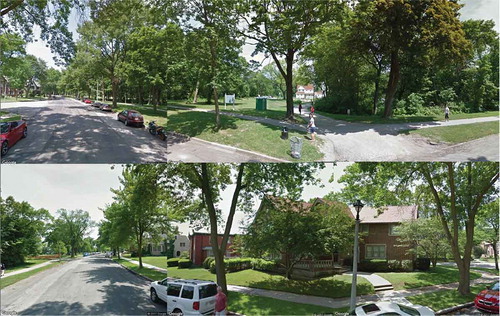
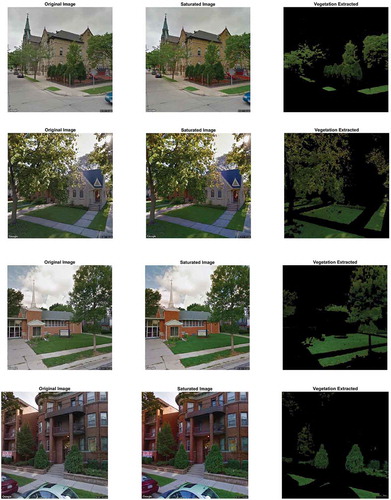
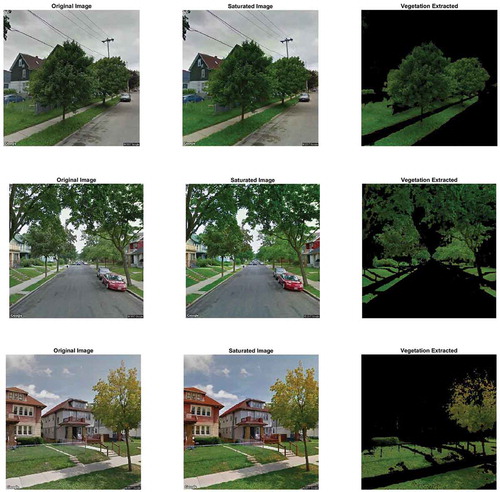
Figure 2. Green vegetation extraction workflow.
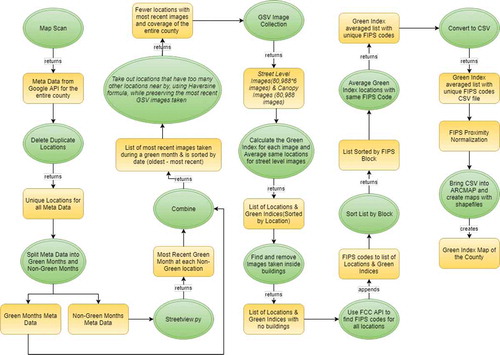
Figure 3. Milwaukee images during “green” and “non-green” months.
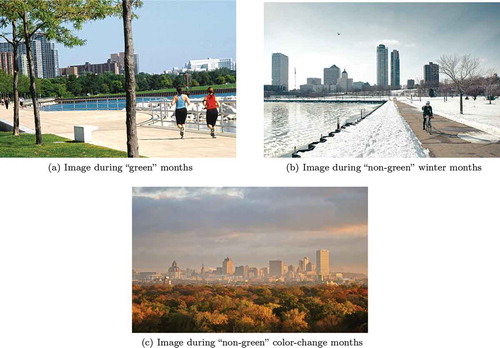
Figure 4. Vegetation extraction image processing flow chart.

Figure 5. RGB and HSV color space representations.
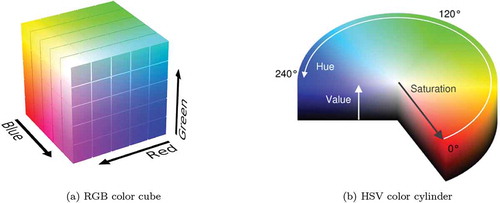
Figure 6. Non-vegetation green street view image components.
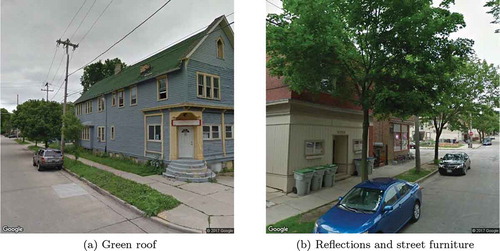
Figure 7. Extreme GSV lighting scenarios.
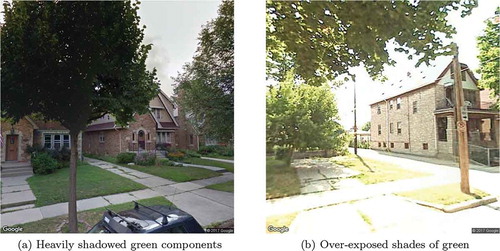
Figure 8. Errors induced by under- and over-processing vegetation filter parametrizations.
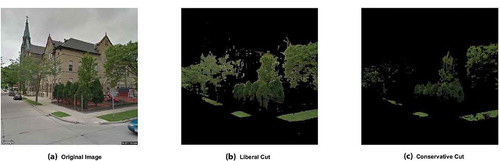
Figure 9. Artificial green image component removal.
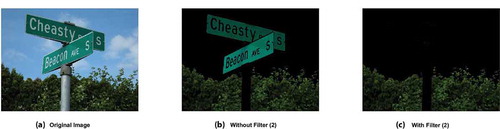
Figure 10. Sample FIPS code.
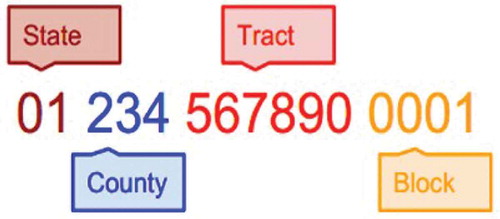
Figure 11. Initial mapping errors.
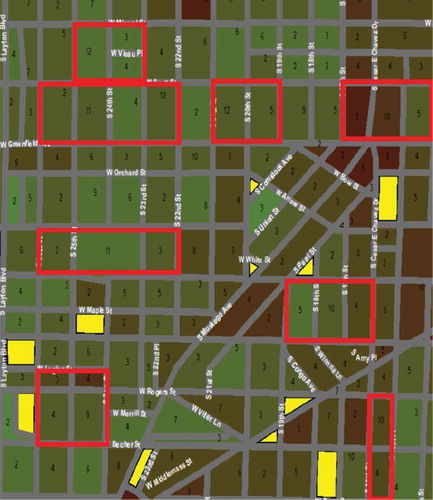
Figure 12. Milwaukee County raw green index FIPS block map, and its correction by proximity normalization.
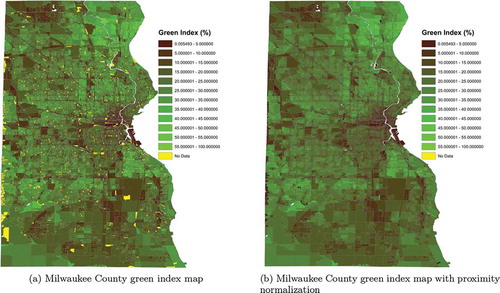
Figure 13. The impact of proximity normalization on the green index assignment.
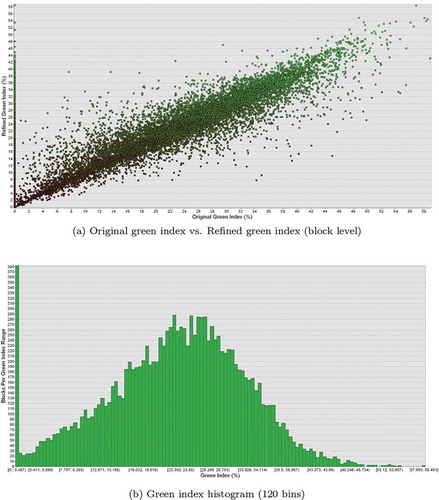
Figure 14. Milwaukee county vegetation maps in more detail.
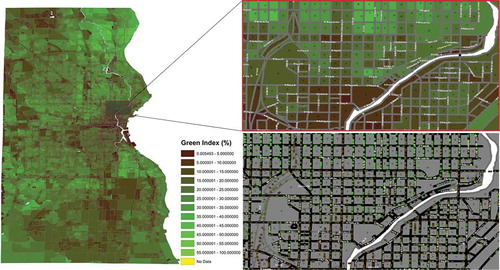
Figure 15. Block-level vegetation canopy map.