Figures & data
Figure 1. Pipeline for collecting and processing data for this study
Figure 2. Volume of tweets in June 2018, categorized by both Sentiment (VADER, 1 to 5) and Tone (from IBM Watson Tone Analyzer)
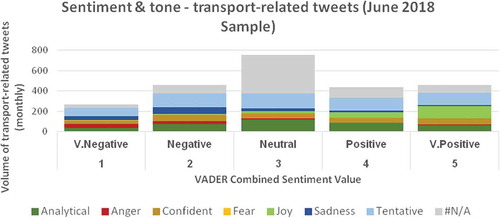
Table 1. LDA results – 12 derived topics, interpretation, and percent of Tweets with that as dominant topic
Figure 3. Daily delayed rail and bus trips in comparison with daily volume of Sydney transport-related tweets over time; annotated with information about significant transport disruptions documented during the year
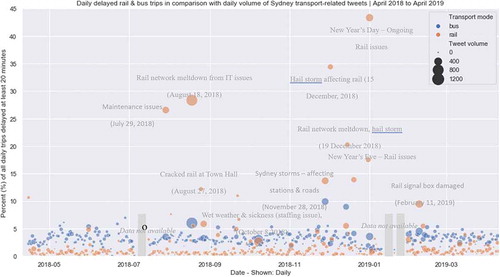
Figure 4. Daily delayed bus trips in comparison with the daily volume of Sydney transport-related Tweets
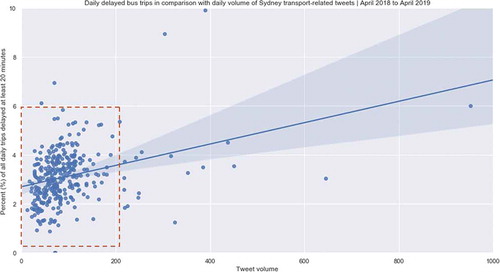
Figure 5. Daily delayed rail trips in comparison with the daily volume of Sydney transport-related Tweets
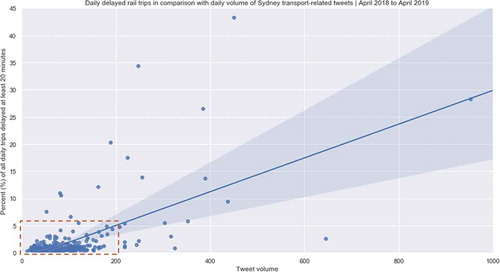
Table 2. Proportion of population in survey sample (social media) versus Labor Force and general population in Sydney
Figure 6. Sample of transport Tweets in Sydney by weekday and time of day
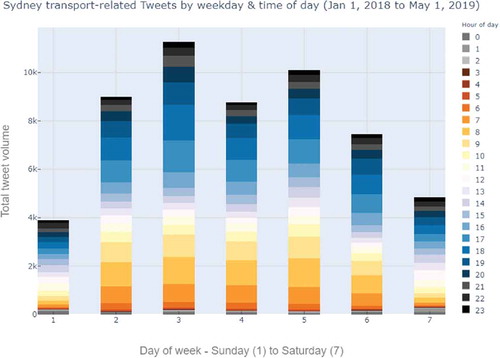
Table A1. Key Twitter search terms used in study
Table A2. Proportion of collected Tweets by inclusion of search term
Table B1. Survey questions
Table C1. Twitter user survey – tweeting about Transport Performance in Sydney – quantitative results
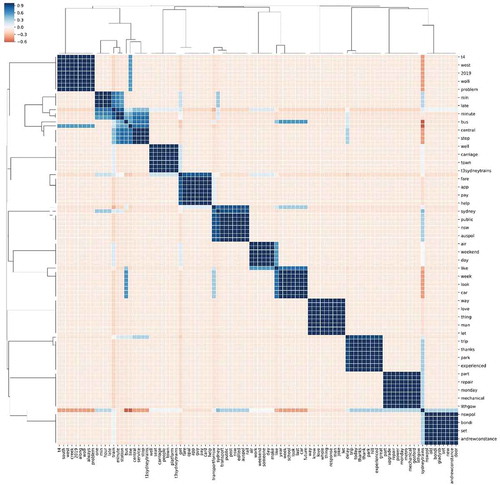
Figure D1. Results of LDA modeling. A darker blue color denotes a stronger relationship between co-occurring words