
Figures & data
Figure 1. The study area was represented by the Landsat 8 OLI image (RGB) on 24 October 2017
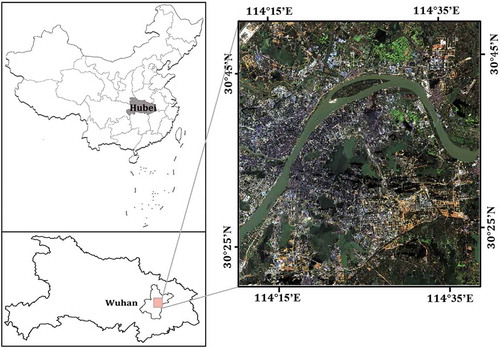
Table 1. Selected LST products and corresponding weather information
Figure 2. The technical flow of this study
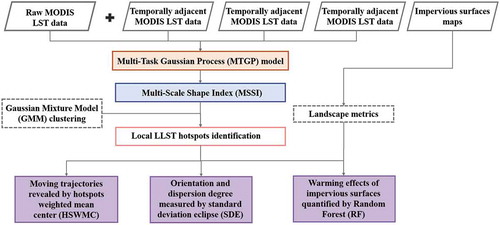
Figure 3. The surface morphological features of LLST patterns (Wang, Zhan, and Guo 2016; Liu et al. Citation2018)
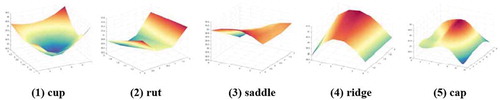
Table 2. Adopted class-level landscape metrics (detailed information can be checked in (Mcgarigal Citation1995))
Figure 4. (a) Raw MODIS LST map on July 28th, 2007 at 1000-m resolution; (b) LLST extracted by MTGP at 500-m resolution; (c) The scattered plot of MODIS LST and resampled 1000-m LLST
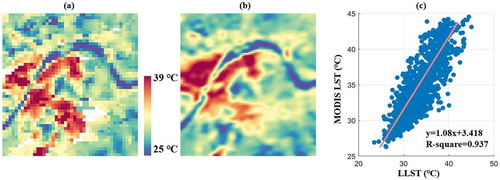
Table 3. Accuracy assessments of LLST patterns from 2002 to 2017
Figure 5. Determination of the optimal clusters for spatial clustering in GMM using average AIC value in four years
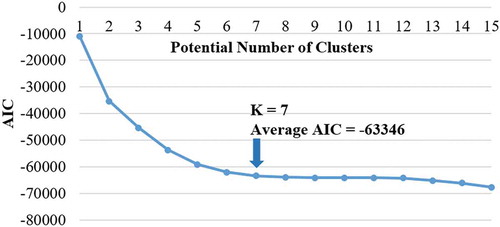
Figure 6. The spatial differentiation of LLST patterns from 2002 to 2017. (a) 2002; (b) 2007; (c) 2012; (d) 2017
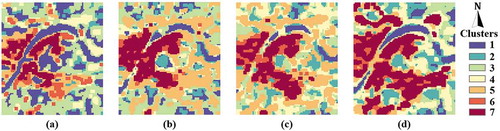
Table 4. LLST and MSSI values of 7 specific clusters
Figure 7. The spatial pattern of hotspots weighted mean centers (HSWMCs) from 2002 to 2017
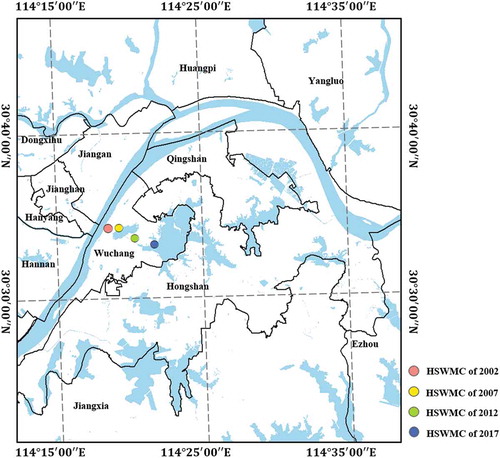
Table 5. LLST and MSSI values of 7 specific clusters
Figure 8. Standard Deviation Eclipses (SDEs) of local LLST hotspots within Wuhan
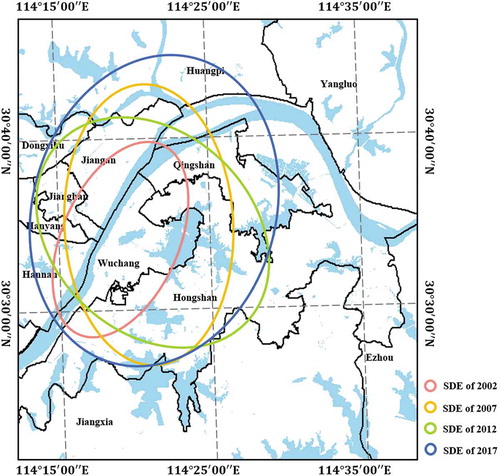
Table 6. Parameters of SDEs from 2002 to 2017
Figure 9. Variable Importance Measurements (VIMs) of landscape metrics in (a) 2002, (b) 2007, (c) 2012 and (d) 2017
Data availability statement
The raw land surface temperature data can be obtained from the Level 1 and Atmosphere Archive and Distribution System (LAADS, https://ladsweb.modaps.eosdis.nasa.gov/).