
Figures & data
Figure 1. P, MS, and WFV images acquired by the GF-6 satellite. (a) P, (b) MS (bands 4, 3, and 2), (c) WFV (bands 3, 2, and 1)
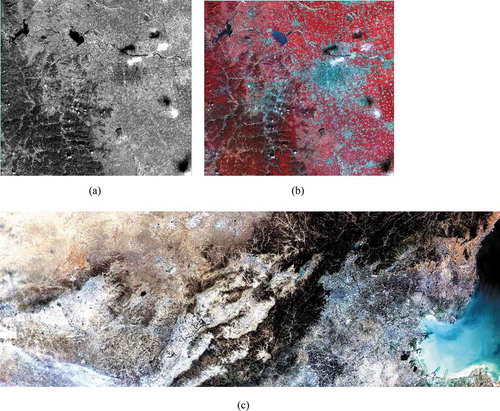
Table 1. Main parameters of China’s high-resolution remote sensing satellites
Table 2. Main parameters of China’s commercial high-resolution satellites
Figure 2. TLC stereo imaging mode
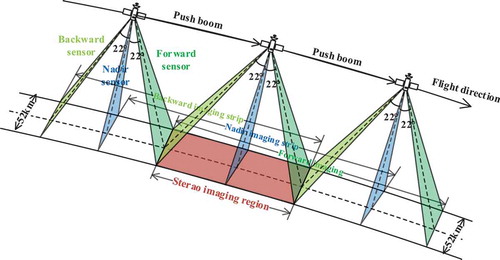
Figure 3. ZY-3 TLC images covering Shandong Province
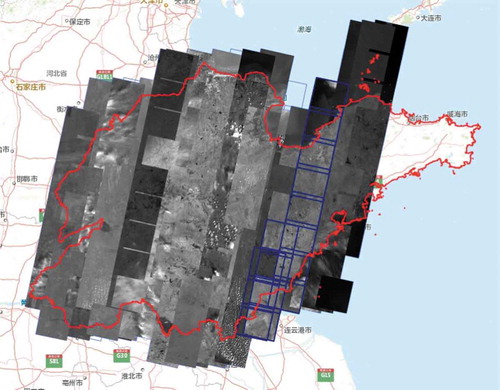
Table 3. Mapping accuracy of ZY-3 satellite
Figure 4. High mountain mapping results by China. (a) High-precision mapping result. (b) Mapping result of Nanga Parbat region
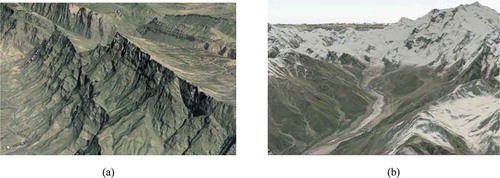
Figure 5. DLC stereo imaging mode
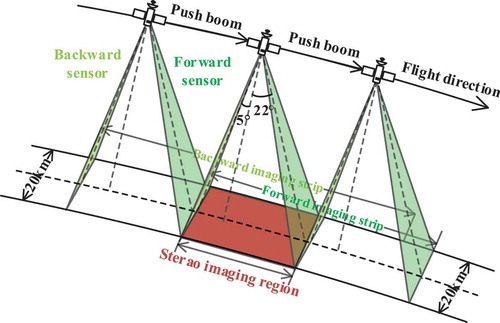
Figure 6. SLC stereo imaging mode
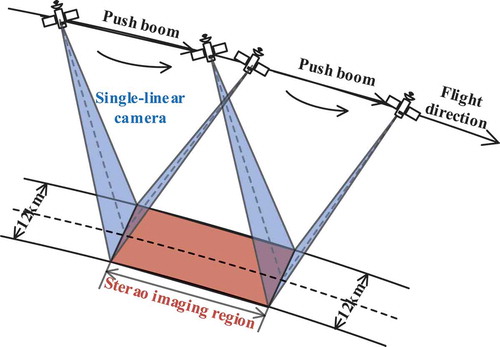
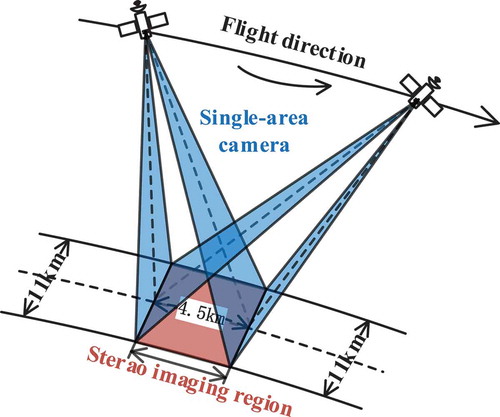
Figure 7. SAC stereo imaging mode
Data availability statement
The raw data used to support the findings of this study have not been made available and shared at this time as the data also form part of an ongoing study. The ZY-3 data used and other China satellite data can be queried and downloaded from the website of China Centre for Resources Satellite Data and Application (CRESDA) (http://www.cresda.com/CN/).