
Figures & data
Figure 1. Location of the state of São Paulo in Brazil (a) and of the city of São Carlos in the state of São Paulo (b). São Carlos subdivisions into weighting areas (c) and census tracts (d)
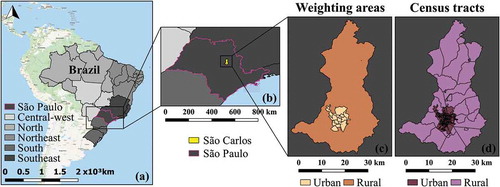
Figure 2. Overview of the method. Source: Lara (Citation2019)
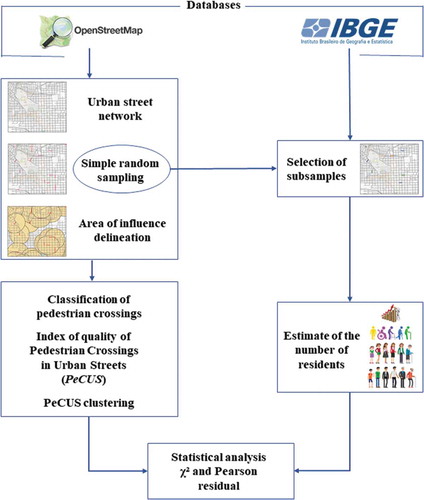
Figure 3. Overview of the method. Source: Lara (Citation2019)
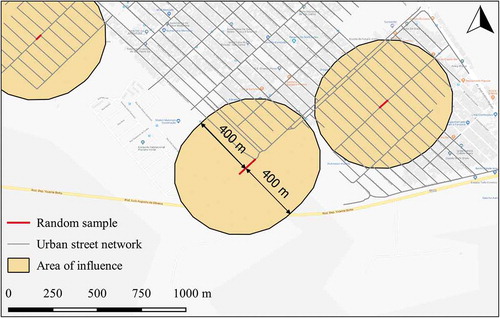
Table 1. Summary of the criteria assessed for classifying pedestrian crossings on urban streets, as suggested by Lara (Citation2019)
Figure 4. Urban street network, in gray, and random sample (n0 = 100 segments), highlighted in red
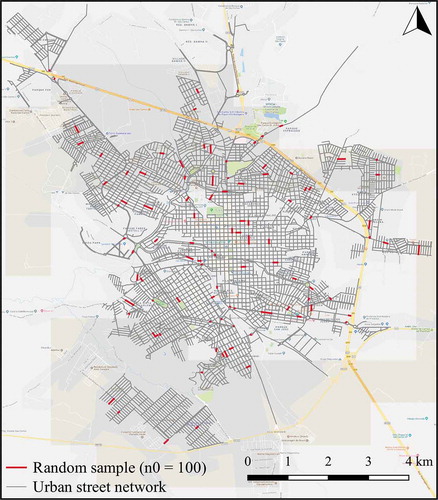
Table 2. Number of segments of urban streets assigned per class
Table 3. Results of the highest and lowest values for the PeCUS index and their corresponding scores for each criterion assessed (indicated by the segment’s ID)
Figure 5. Number of residents distributed by class of the PeCUS index, for each subsample and for each variable
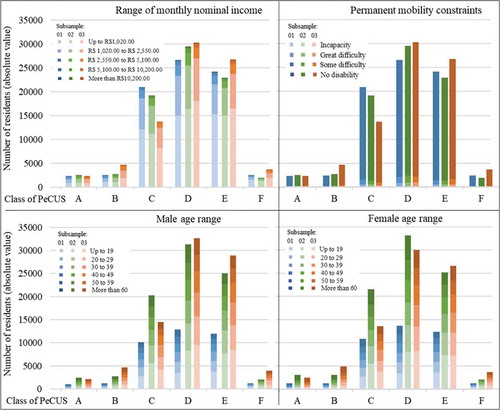
Figure 6. Number of residents by range of monthly nominal income distributed by class of the PeCUS index, for the three subsamples
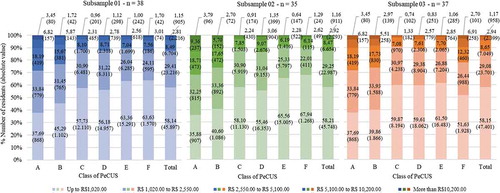
Figure 7. Number of residents by permanent mobility constraints distributed by class of the PeCUS index, for the three subsamples
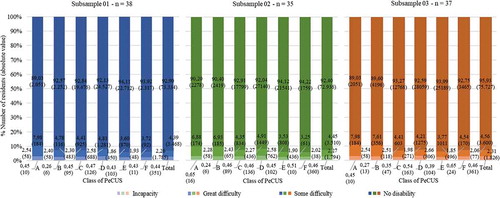
Figure 8. Number of male residents by age distributed by class of the PeCUS index, for the three subsamples
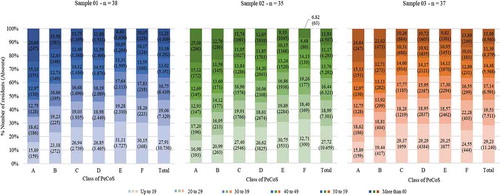
Figure 9. Number of female residents by age distributed by class of the PeCUS index, for the three subsamples
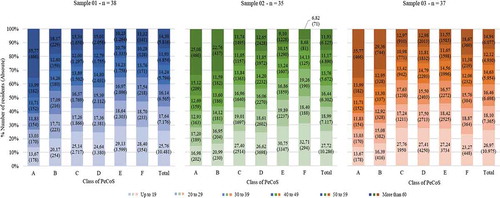
Table 4. Summary of excesses and deficits for each class of the PeCUS index per variable for the three subsamples
Data availability statement
The data that support the findings of this study are available on request from the corresponding author.