
Figures & data
Table 1. Number of trajectory samples (within parentheses) per intersection used in this study. With A, B, C, D, E, and F we distinguish the different intersections we use in our analysis
Figure 1. Sample trajectories from the six intersections of the study. Source: Imagery © 2020 GeoBasis-DE/BKG, GeoContent, Maxar Techonologies, Map data © 2020 GeoBasis-DE-BKG (© 2009)
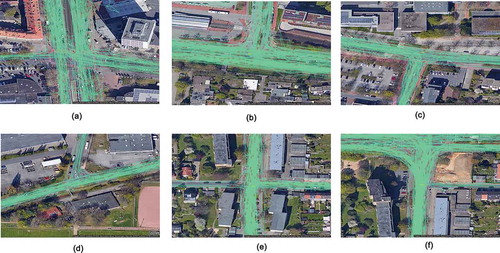
Figure 2. The average performance of different similarity measures and clustering methods with 95% confidence level
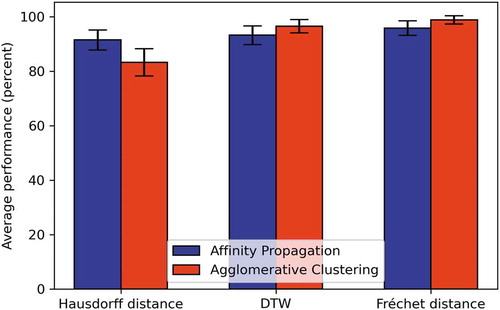
Figure 3. Clusters of speed ((a), (b), (c) and time (d) development from North to South at intersection A (traffic-light). 0 point in the x-axis, is denoted the intersection center. The negative distance denotes the distance (trajectory length) of the location of a vehicle from the intersection before the former crosses the junction center. Positive distance corresponds to the distance the vehicle has from the intersection center after it has crossed the intersection center
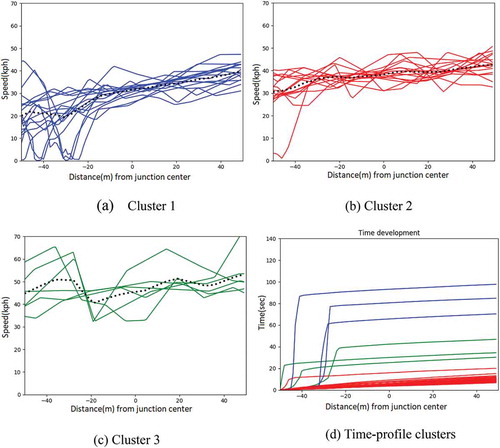
Figure 4. Clusters of speed ((a), (b), (c)) and time (d) development from East to West at Intersection B (traffic-light)
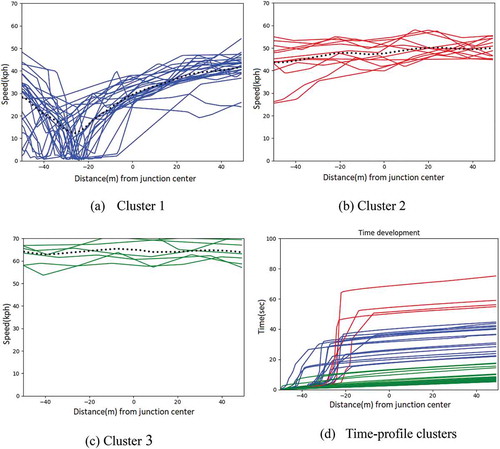
Figure 5. Different clusters of speed and time development at Intersection C from West to East (a, b, c), where a priority traffic-sign regulates the traffic and from South to West (d, e, f) where a yield-sign is valid. Similarly, plots g, h, i, j refer to Intersection D, from West to East, where vehicles have priority over other participants
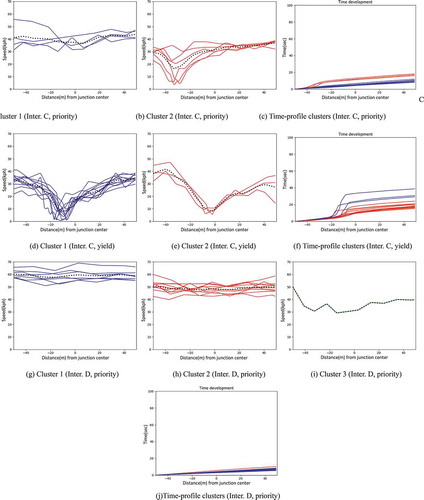
Figure 6. Different clusters of speed and time development at Inter. E from North to South and at Inter. F from South to North. Both junctions are uncontrolled (right-of-way priority rule)
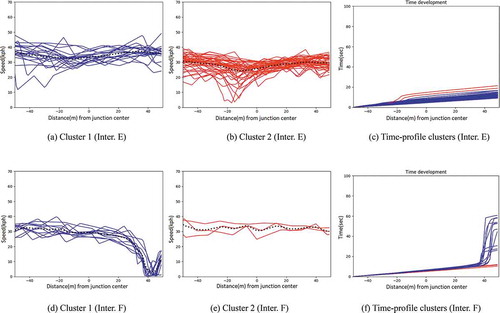
Table 2. Clustering accuracy of the three tested similarity measures with 95% confidence level
Data availability statement
The data that support the findings of this study are openly available in Research Data Repository of the Leibniz University Hannover at https://data.uni-hannover.de, reference number https://doi.org/10.25835/0043786.