
Figures & data
Figure 1. Target area. (This map is created based on content from the Keihanshin Metropolitan Transportation Planning Council Citation2019 homepage.)
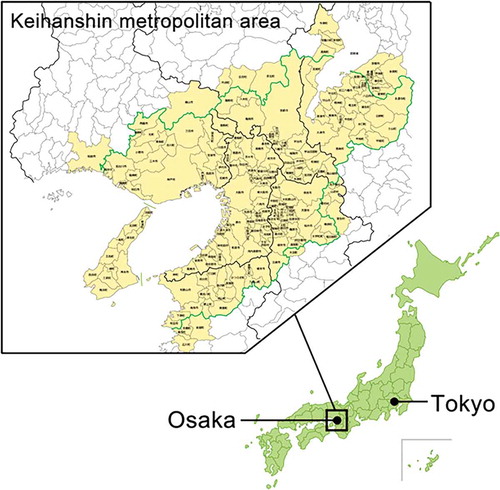
Table 1. The person trip (PT) Survey summary
Figure 2. Aggregate results for age (n = 44,454)
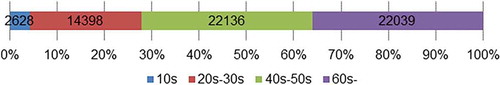
Figure 3. Aggregate results for sex (n = 44,454)
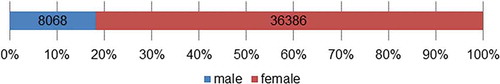
Figure 4. Aggregate results for occupations (n = 44,454)
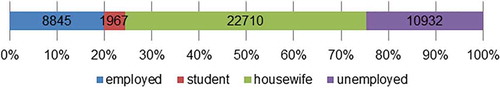
Figure 5. Aggregate results for transportation means (n = 61,201, multiple answers)
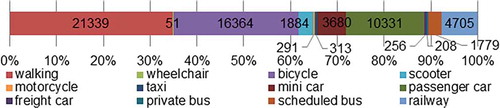
Figure 6. Departure time from home in six-hour categories (n = 44,454)
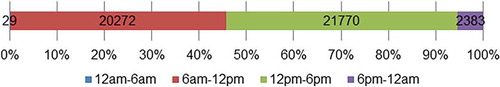
Figure 7. Travel time in five-minute intervals (n = 44,454)
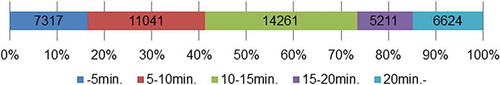
Figure 8. Travel distance in 1 km intervals (n = 44,454)
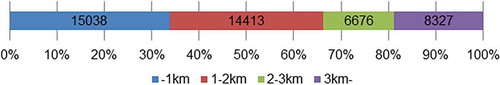
Figure 9. Duration of time at the destination in 15 min intervals (n = 44,454)
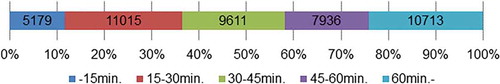
Table 2. Results of the chi-square test and residual analysis involving occupation and transportation means (p < 0.001)
Table 3. Results of the correspondence analysis involving occupation and transportation means
Figure 10. Visual diagram of the correspondence analysis involving occupation and transportation means
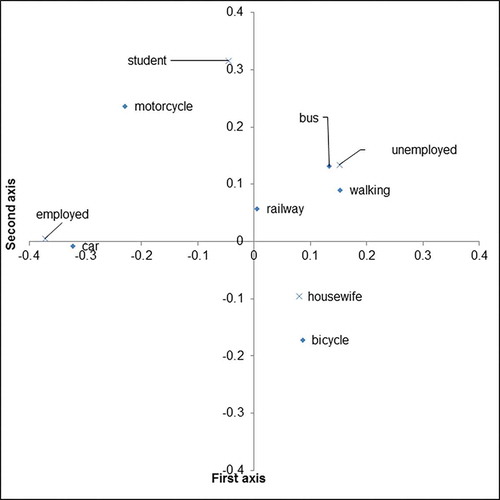
Table 4. Results of the chi-square test and residual analysis involving travel time and transportation means (p < 0.001)
Table 5. Result of the correspondence analysis involving travel time and transportation means
Figure 11. Visual diagram of the correspondence analysis involving travel time and transportation means
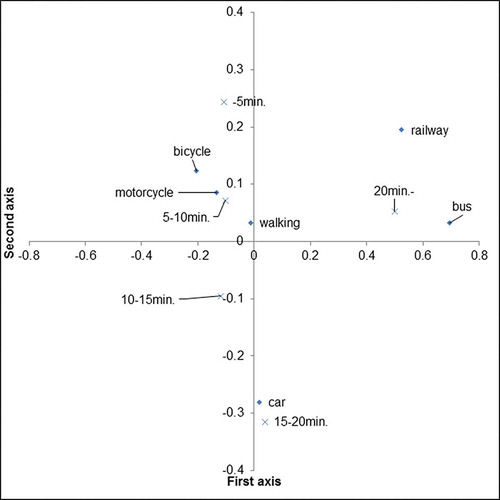
Table 6. Results of the chi-square test and residual analysis involving duration of time at the destination and transportation means (p < 0.001)
Table 7. Results of the correspondence analysis involving duration of time at the destination and transportation means
Figure 12. Visual diagram of the correspondence analysis involving duration of time at the destination and transportation means
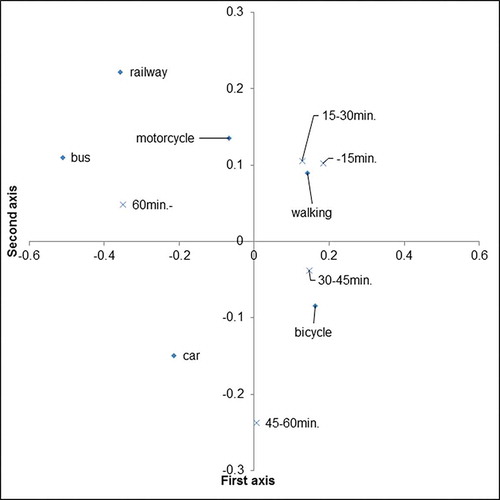
Table 8. Cluster center results and number of cases for each cluster
Figure 13. Plot results of the cluster analysis
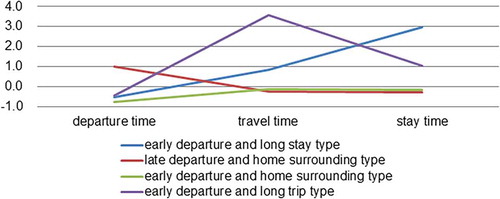
Table 9. Results of the multiple regression analysis using the logarithm of duration of time at the destination as the dependent variable and travel time log as the independent variable (R2 = 0.915)
Table 10. Results of the multiple regression analysis using the logarithm of duration of time at the destination as the dependent variable and several independent variables (R2 = 0.955)
Data availability statement
The data that support the findings of this study are available from Center for Spatial Information Science (CSIS), www.csis.u-tokyo.ac.jp/english/. The University of Tokyo, but restrictions apply to the availability of these data, which were used under license for the current study, and so are not publicly available. Data are however available from the authors upon reasonable request and with permission of CSIS.