
Figures & data
Figure 1. Technical route
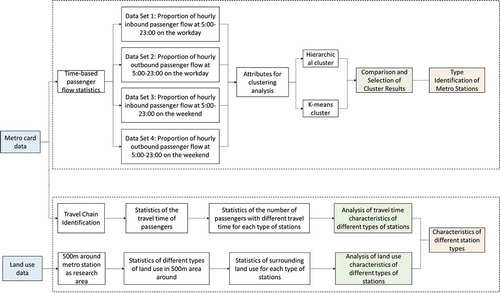
Figure 2. Spatial distribution of various stations
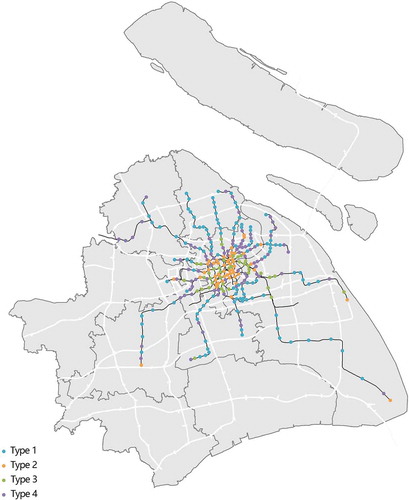
Figure 3. Average inbound and outbound passenger flow on the workday and weekend of type 1 stations
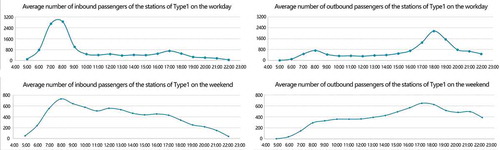
Figure 4. Average inbound and outbound passenger flow on the workday and weekend of type 2 stations
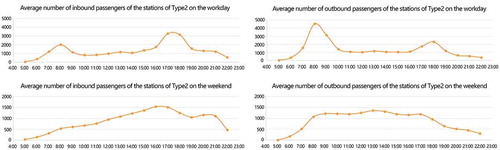
Figure 5. Average inbound and outbound passenger flow on the workday and weekend of type 3 stations
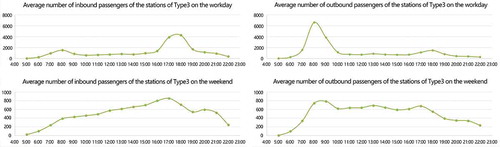
Figure 6. Average inbound and outbound passenger flow on the workday and weekend of type 4 stations
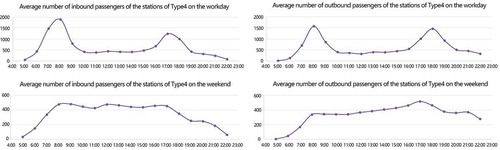
Figure 7. Average proportion of inbound and outbound passenger flow on working and weekend days of four types of stations
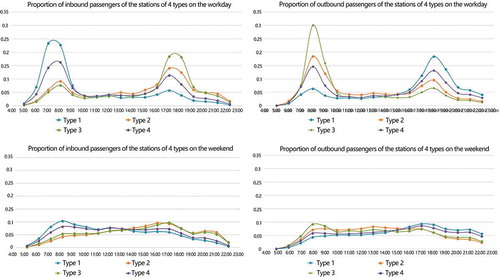
Table 1. Summary of the characteristics of inbound and outbound passenger flow on weekday and weekend of four types of stations
Figure 8. Daily average number and proportion of passengers with different travel time
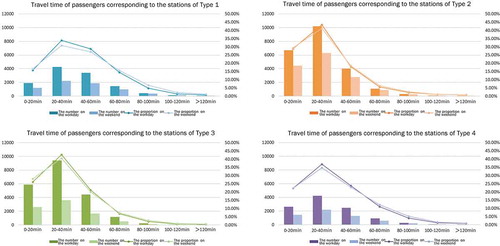
Figure 9. Proportions of different types of land use in the 500 m range around different types of stations
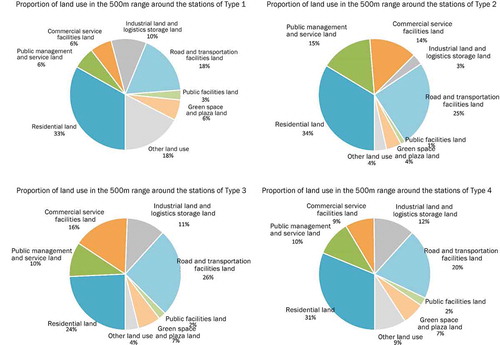
Figure 10. Z-score values of different types of land-use areas within 500 m around different types of stations
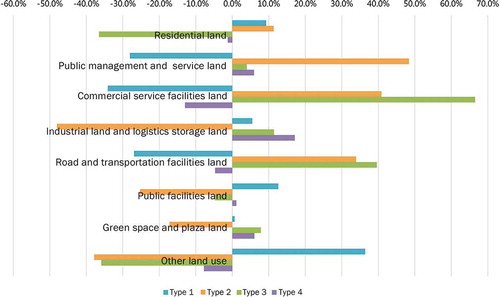
Table 2. Summary of classification characteristics of Shanghai metro stations
Data availability statement
The data that support the findings of this study are available on reasonable request from the corresponding author.