
Figures & data
Figure 1. Four-dimensional space of analysis of the spatial equity of accessibility
Figure 2. Green space distribution and geographic location of the Tehran megacity as the case study area
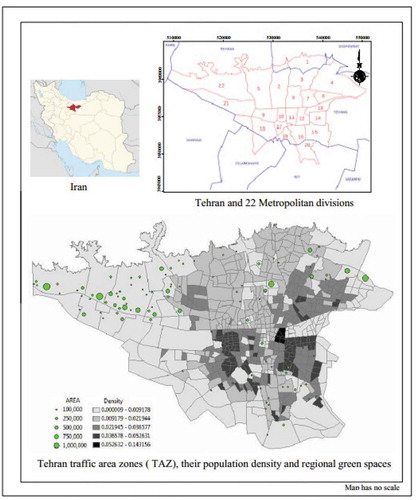
Figure 3. Relations between population density (horizontal axis) and park area density (vertical axis) in the study area
Figure 4. Cumulative frequency of parks located in different distances from TAZs in the study area
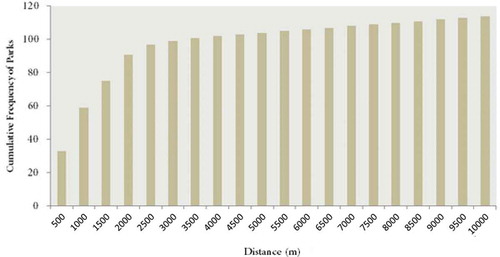
Figure 5. Traffic maps showing average speeds and dynamics of three traffic classes and relations between the network distance (meters in the horizontal axis) and TTs (minutes in the vertical axis) at five sample times
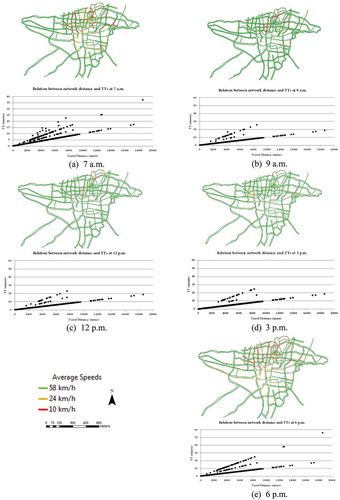
Figure 6. Linear relations between the distance to the 3 nearest parks of residents and average daily TT of distance classes
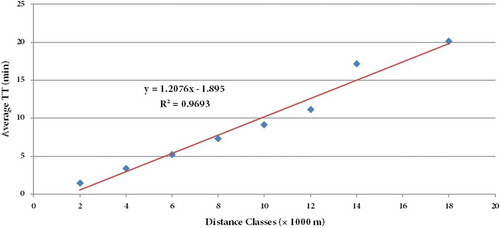
Figure 7. Nonlinear relations between the distance to the 3 nearest parks and VTTs of distance classes in five sample times (7 a.m., 9 a.m., 12 p.m., 3 p.m. and 6 p.m.) and a sharper increase of VTT in longer distances during the two peak traffic hours of 7 a.m. and 6 p.m
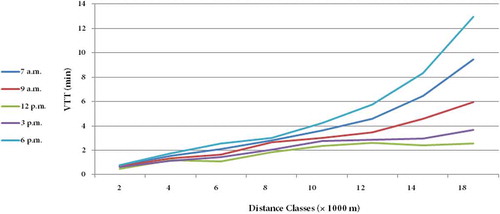
Figure 8. Distance of TAZs to their (a) top-1, (b) top-2, (c) top-3, (d) top-1 and top-2, (e) top-2 and top-3, (f) top-1 and top-3 and (g) top-1, top-2 and top-3 closest parks
Figure 9. Number of TAZs in different distances from their top-1, top-2, top-3, top-1 and top-2, top-1 and top-3, top-2 and top-3, top-1 and top-2 and top-3 closest parks
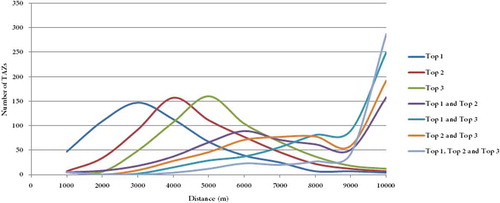
Figure 10. Total area (ha) of TAZs with unfavorable accessibility (more than 20 min) to the 3-closest parks
Figure 11. Maps showing the spatial distribution of unfavorable areas (with travel times of more than 20 min) at 5 times (7 a.m., 9 a.m., 12 p.m., 3 p.m. and 6 p.m.) of a working day and a significant increase of these areas at 7 a.m. and 6 p.m., the most traffic-congested times
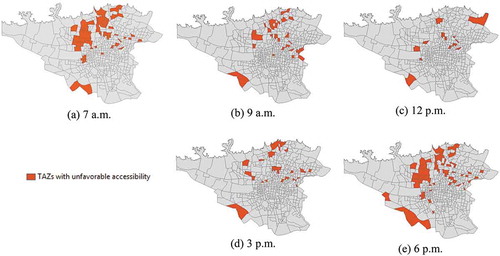
Figure 12. Lorenz curve of all population of the study area, for sample times of 7 a.m., 9 a.m., 12 p.m., 3 p.m., and 6 p.m. during a working day
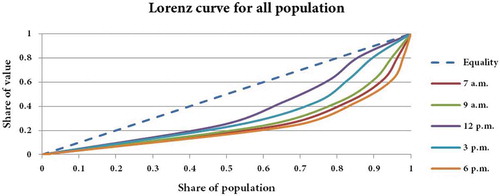
Figure 13. Relations between the daily TTmax (vertical axis) and ATT (horizontal axis) for the three closest parks in the study area
Figure 14. Strong linear relationship between the TTmax (vertical axis) and the distance from the three closest parks (horizontal axis) for TAZs of pattern 1 in the study area
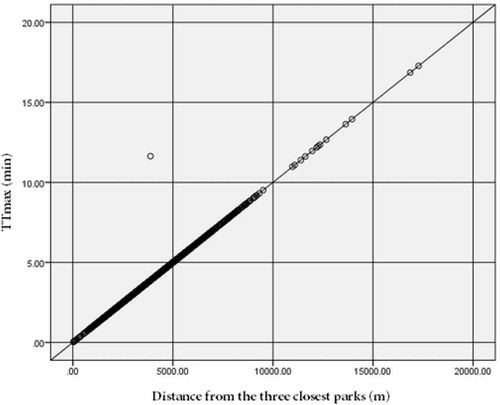
Figure 15. Frequency of TTmax distribution (with maximum TTmax of 5 min) in TAZs of pattern 1, selected for having distances of less than 5 km from at least one of the three closest parks
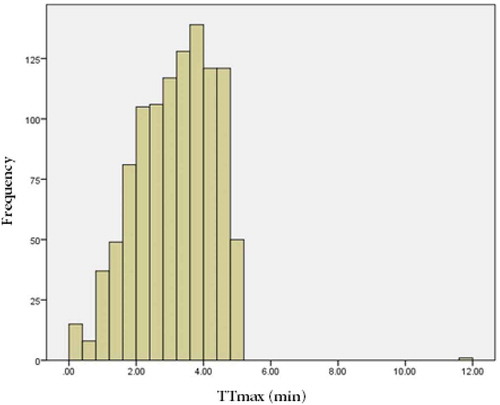
Figure 16. Frequency of TTmax distribution (with minimum TTmax of 5 min) in TAZs of pattern 1 selected for having distances of more than 5 km from the three closest parks
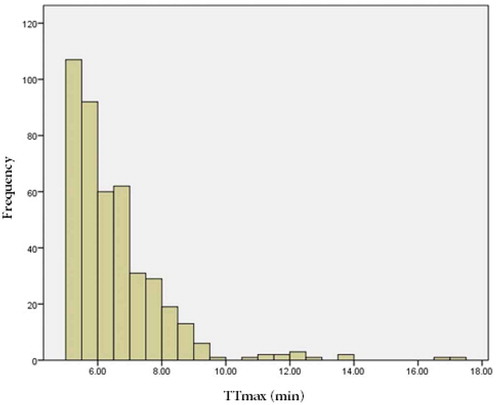
Figure 17. Relations between the TTmax (vertical axis) and the distance from the three closest parks (horizontal axis) for TAZs of pattern 2 in the study area
Figure 18. Frequency of TTmax distribution (with maximum TTmax of 12 min) in TAZs of pattern 2 selected for having distances of less than 4 km from at least one of the three closest parks
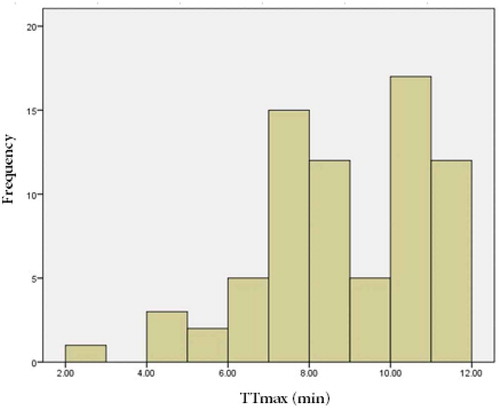
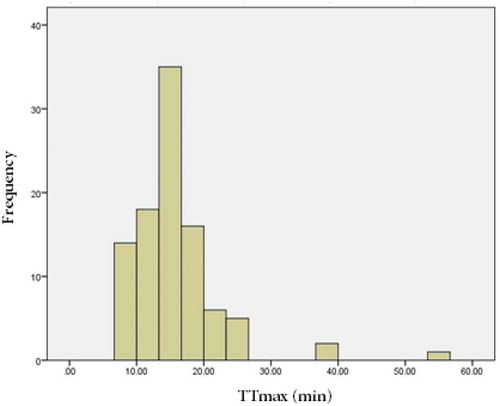
Figure 19. Frequency of TTmax distribution (with minimum TTmax of 8 min) in TAZs of pattern 2 selected for having distances of more than 4 km from the three closest parks
Data availability statement
The data that support the findings of this study were derived from the following resources available in the public domains: “https://map.tehran.ir/”; “https://www.google.com/maps/@35.7138432,51.3396774,12z” and “https://www.amar.org.ir”. These data are also available from the corresponding author, Alimohammadi, A. upon reasonable request.